
morsagh - 1-10-2015 at 10:41
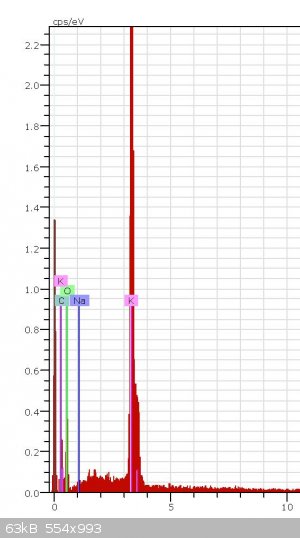
Can somebody know from this XPS graph what it is (-COOK or K2CO3) and how did you know it?
Thank you very much
Squall181 - 2-10-2015 at 10:52
This does not look like an XPS spectra. This looks more like EDS. The software that plots this data is capable of giving you estimates of atomic
percentages for each element present, and the percentages can give you an idea of what the compound could be, but it could also just be a mixture of
several compounds containing these elements. It would be pretty difficult to say which compound this spectra belongs too because EDS tells us nothing
about the bonding between the elements. On the other hand XPS does discern the bonding energies, therfore if we had high resolution XPS scans of the
oxygen, potassium and carbon peaks from an XPS spectra then perhaps we would be able to say which compound it was.
So, from this spectra all you can say is that these elements are present in your sample and if you normalize the peak intensities and take their
ratios you may be able to guess a compound, but it would not be conclusive.
unionised - 2-10-2015 at 11:14
This seems like a lot of trouble to go to in order to answer a question that could be addressed by seeing if the stuff fizzes when you add vinegar.
morsagh - 3-10-2015 at 10:05
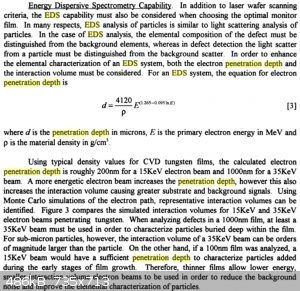
And how "deep" can EDS go? If I will have 20μm thick layer of for example zinc on iron will there be peak of iron on scan?
Depends on density and accelerating voltage
WGTR - 3-10-2015 at 20:20
pg. 135,
ISBN: 1-56677-041-6
[Edited on 10-4-2015 by WGTR]