AJKOER
Radically Dubious

Posts: 3026
Registered: 7-5-2011
Member Is Offline
Mood: No Mood
|
|
Snowfall Amounts Follow a Weibull Distribution?
Why does the amount of snowfall during NYC cold months (more precisely November to April) apparently follow a Weibull (or related like the Gamma or
special cases which includes the exponential) distribution?
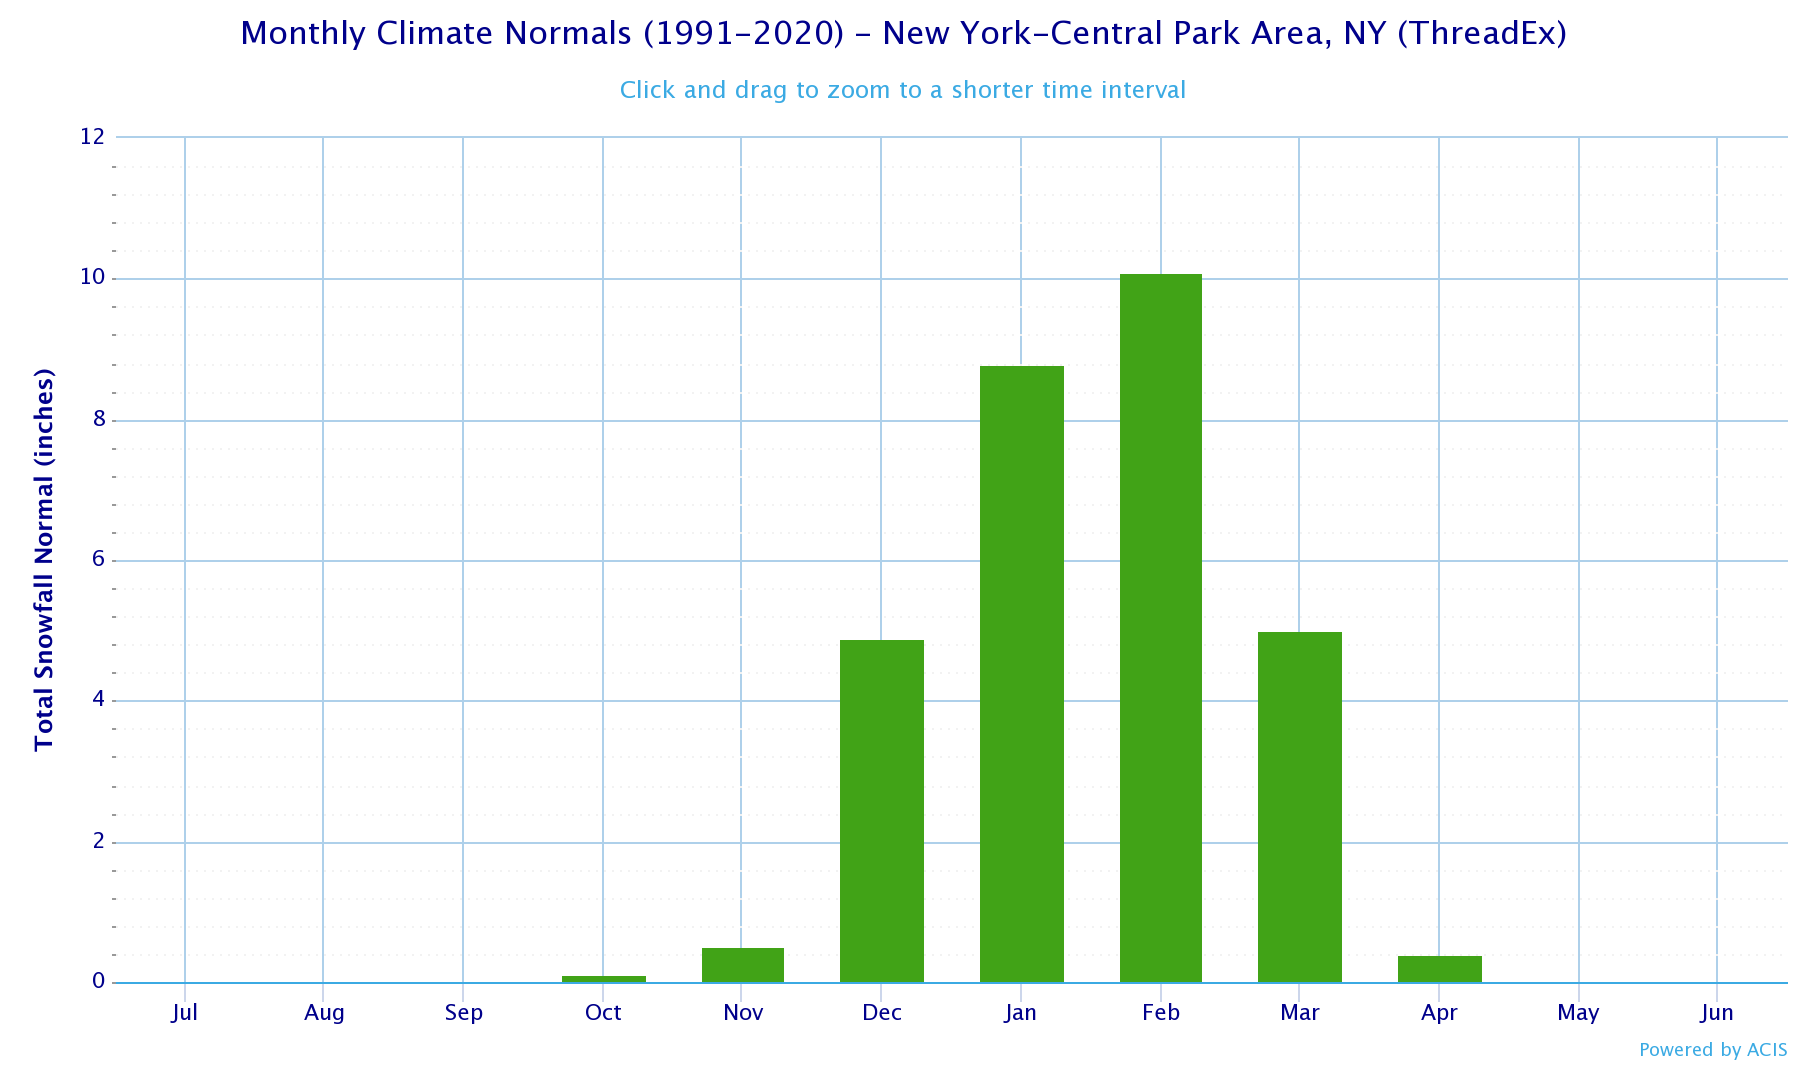
Data background, an examination of snowfall in inches for NYC (see, for example, https://www.currentresults.com/Weather/New-York/Places/new-y... and also https://www.weather.gov/media/okx/Climate/CentralPark/monthl... ) appears to be consistent with a hypothesis of a continuous two-parameter Weibull
density function (see https://en.wikipedia.org/wiki/Weibull_distribution with parameters Lambda = 1, k =1.5, and here is a link to just the uploaded pdf at https://upl
oad.wikimedia.org/wikipedia/commons/5/58/Weibull_PDF.svg . Here is a bar graph at https://www.weather.gov/images/okx/Climate/CentralPark_Snowf... ,
The possible significance relating to the appropriateness of employing a Weibull density function, for such things as snowfall amounts/days, is that
it can be employed to simulate discrete scenarios for planning purposes.
Wikipedia, as one source, makes some interesting comment with respect to the Weibull distribution, for example:
“ first applied by Rosin & Rammler (1933) to describe a particle size distribution.”
Relatedly, on the mechanics of snowflake construction, one reference says (see https://blog.advancementcourses.com/classroom-activities/the... ):
“According to the National Oceanic and Atmospheric Administration (NOAA), snowflakes form when dust or pollen particles come into contact with water
vapor and freeze high in the Earth’s atmosphere. When it freezes, the particle forms a crystal of ice and the process of building a snowflake
begins. The water molecules inside each crystal arrange themselves into a six-sided structure.”
I would argue that the process of snowflake formation may involve a critical mass determination, at which point, precipitation of the ice crystal
occurs. As particle size distribution can be modeled by a Weibull distribution, snowfall perhaps also. Supporting reference for the Weibull is based
on its suggested use for rain distribution in this paper https://rmets.onlinelibrary.wiley.com/doi/pdf/10.1002/joc.11... . This paper involved a warmer region (Spain) and in other colder locales (like
NYC), rain becomes ice/snow. Did find a source referencing the use of the Exponential distribution at https://www.geosci-model-dev.net/12/3759/2019/ for Artic snowfall.
Comments welcome including some of the science relating on how particle size may be material.
-----------------------------------------------------
Some assorted comments from the Wikipedia article:
“If the quantity X is a "time-to-failure", the Weibull distribution gives a distribution for which the failure rate is proportional to a power of
time. The shape parameter, k, is that power plus one, and so this parameter can be interpreted directly as follows:[3]“
“For k > 1, the density function tends to zero as x approaches zero from above, increases until its mode and decreases after it.”
“A value of k>1 indicates that the failure rate increases with time. This happens if there is an "aging" process, or parts that are more likely
to fail as time goes on. In the context of the diffusion of innovations, this means positive word of mouth: the hazard function is a monotonically
increasing function of the proportion of adopters. The function is first convex, then concave with an inflexion point"
[Edited on 19-11-2019 by AJKOER]
|
|
|
mayko
International Hazard
Posts: 1218
Registered: 17-1-2013
Location: Carrboro, NC
Member Is Offline
Mood: anomalous (Euclid class)
|
|
well... it's not apparent to me that snowfall is "consistent" with a Weibull distribution, because you've just sort of tossed out a bunch of links to
tabular data without providing any statistical analysis or formal hypothesis testing. You provide a visual aid ("Here is a bar graph") but it clouds
the issue rather than clarifying it. Before I looked at it, I thought I understood what you were talking about, but now I think at least one of us is
confused.
so, I'll ask: "How does that bar graph relate to the topic?" and in the meantime go ahead with what I think a reasonable approach here is.
I munged the data at https://www.weather.gov/media/okx/Climate/CentralPark/monthl... into a TSV flatfile; entries with T were rounded down to zero. (T stands for
Trace, right? Is there a README for this data?), Snowfall between November and April inclusive were summed to get a winter total. The first year on
record had incomplete data, and was excluded.
Here is the distribution of total snowfall amounts as a histogram:
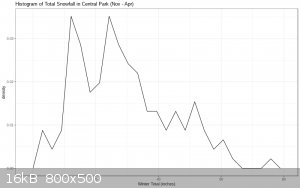
Something that pops right out to me is that it's positively skewed: most winters fall between 0 and 40 inches, but there is a long tail of heavy
snowfall. This skewness also appears to be significant (Of 1000 simulated normal distributions of the same length, only 2, ie 0.2%, had a greater
skew.) Positive skewness is the main feature of the Weibull distribution under the parameters you've specified. So, in that sense, this distribution
is "consistent" with a Weibull distribution.
However, there are a lot of distributions which are positively skewed, at least under some choices of parameter, and so this data is just as
"consistent" with them in that sense. I don't see any evidence that any one of them is actually a better fit than any other (is it obvious that these
data are less consistent with the beta distribution than with the Weibull?). There might be a theoretical reason to expect the Weibull distribution to
model this distribution, but that isn't clear to me either.
It sounds like you're trying to investigate the process by which snowstorms begin, which is definitely interesting... but it seems to me that the
amount of snowfall is an indirect and heavily confounded measure of snow initiation. (The amount of water vapor available to precipitate, ie humidity,
is a major determinant!) If available, I'd probably start with the frequency of snowstorms, or better yet, the time in between them.
al-khemie is not a terrorist organization
"Chemicals, chemicals... I need chemicals!" - George Hayduke
"Wubbalubba dub-dub!" - Rick Sanchez
|
|
|
AJKOER
Radically Dubious
Posts: 3026
Registered: 7-5-2011
Member Is Offline
Mood: No Mood
|
|
Mayko thanks for your work and interest!
If you could load the data into a worksheet and post it that may allow me and others to perform some statistical investigations.
I agree that is possible for there to be a wide range of possible selections for the best fitting distribution. My modeling/forecasting experience
suggests always work with the more parsimonious model (to avoid overfitting and in my experience, inferior forecast) and select a model that has some
underlying fundamental rationale (whether based on science or economic theories,...so that the model remains valid in changing conditions). In the
current context, if particle size distribution is key, and there is a rationale for the weibull in this regard promoting its selection.
But having several distributions to select from is also informative as one could produce a random selection step for the choice of distribution in a
simulation exercise. But, I feel there should be a rationale as to why several distributions relate to the phenomena being observed.
My guess is that data and insight in modeling rain patterns may be applicable also, as snow is the product of confounding of possible rain with a
low-temperature distribution.
At least I think getting even rough parameter estimates may be insightful in predicting the odds of getting buried alive in a snow storm!
For some reason, I feel that our government is NOT always willing to reveal predictions that would inspire some of us to go south!
Changing weather conditions due to global warming (GW) likely just adds to the variability of estimates. Together with the total denial, by heads of
governments, no less, of the very existent of GW, just adds to my angst.
[Edited on 22-11-2019 by AJKOER]
|
|
|
mayko
International Hazard
Posts: 1218
Registered: 17-1-2013
Location: Carrboro, NC
Member Is Offline
Mood: anomalous (Euclid class)
|
|
sure thing!! (year ranges have been rounded down)
Attachment: CentralParkSnowfall.csv (7kB)
This file has been downloaded 322 times
I noticed something else when I looked at the winter total as a time series: Although I haven't done any significance testing, there seems to be a
depletion of heavy snowfall around 1970-1990:
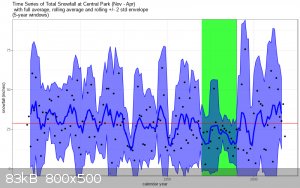
This appears to be contributing some, but not all, of the distribution's asymmetry (excluding those two decades, only 1% of normals had a skew at
least as positive).
Incidentally, there are only four years with snowfall to speak of outside Nov-Apr; all of them were early snow in October:
| Code: |
   year   OCT nonWinter
  <dbl> <dbl>     <dbl>
1  1876   0.5      0.5
2  1925   0.8      0.8
3  1952   0.5      0.5
4  2011   2.9      2.90
|
[Edited on 23-11-2019 by mayko]
al-khemie is not a terrorist organization
"Chemicals, chemicals... I need chemicals!" - George Hayduke
"Wubbalubba dub-dub!" - Rick Sanchez
|
|
|
AJKOER
Radically Dubious
Posts: 3026
Registered: 7-5-2011
Member Is Offline
Mood: No Mood
|
|
Thanks for the data!
Did some work:
Total Snow Fall
OCT 4.7
NOV 125.4
DEC 817.9
JAN 1190.8
FEB 1337.7
MAR 752.6
APR 121.9
which shows a peak in February. However, on the data analysis, Wiki on the Weibull distribution employs a rank transformation, so working with total
snowfall amounts transformed to rank:
Rank of Above Total Snow Fall:
OCT 1
NOV 3
DEC 5
JAN 6
FEB 7
MAR 4
APR 2
However, working with each year's rank transformed data, and taking the column average:
Col Avg on Rank Transformed Data:
OCT 2.742
NOV 3.358
DEC 4.960
JAN 5.722
FEB 5.669
MAR 5.013
APR 3.298
So, working with the rank transformed data appears to suggest a distribution also with more probability mass to the right but with a peak actually in
the month of January, or is the peak actually in the middle of winter, February 5th! The latter is half way between the dates of the Winter Solstice
and Spring (Vernal) Equinox (which can change by a day due to a leap year correction factor). The date is also nearly halfway between Jan 15th and Feb
15th with both months returning nearly the same average rank (differing by only 0.023).
[Edited on 24-11-2019 by AJKOER]
|
|
|
mayko
International Hazard
Posts: 1218
Registered: 17-1-2013
Location: Carrboro, NC
Member Is Offline
Mood: anomalous (Euclid class)
|
|
Ah, this is why I asked about the bar graph.
First, as far as I can tell without context, the bar graph you linked isn't precisely the distribution of snowfall across the months, but the central
tendency of a bunch of different distributions, one for each month. I wouldn't expect a huge difference when they were scaled down, but I wouldn't
expect them to be identical, either.
A more serious problem with what you seem to be trying to do, is that Weibull is a continuous distribution, whereas the months are a discrete domain.
It's not an appropriate distribution for snowfall by month! (Questionable domain *would* be a reason to doubt the beta as a model, since it's defined
on a closed interval, and there's no hard ceiling on total snowfall.) Now, there is an analogous distribution called the discrete Weibull:
https://en.wikipedia.org/wiki/Discrete_Weibull_distribution
But, that doesn't necessarily help much, because it's defined on the natural numbers (0,1,2,...), whereas the months are a finite number of
non-numerical categories. I know how to divide 32 inches by a non-zero lambda...... but how do I divide the month of November?
Finally, the meaning of the distribution of snowfall across months wasn't obvious to me at first so I think it's worth thinking through. Imagine you
save up all the snow that falls for a year, mix it up well, and pull out a single snowflake. The discrete by-month distribution tells you how likely
it is that particular snowflake fell in, say, February. On the other hand, the continuous distribution of snowfall amounts describes how likely it is
that, say, 32 inches of snow fall this year.
al-khemie is not a terrorist organization
"Chemicals, chemicals... I need chemicals!" - George Hayduke
"Wubbalubba dub-dub!" - Rick Sanchez
|
|
|
AJKOER
Radically Dubious
Posts: 3026
Registered: 7-5-2011
Member Is Offline
Mood: No Mood
|
|
I have since examined and obtain parameters for the Weibull based on 150 data points for, separately, the months of Jan and Feb. I used the regression
method discussed in the Wikipedia article (https://en.wikipedia.org/wiki/Weibull_distribution ) .
My results for data from the months of JAN and FEB are as follows:
Month /// k Parameter ///// Lambda
Jan /// 0.972 //// 8.031
Feb /// 1.374 //// 85.031
Focusing on a single month means that there is, on average, more control exercised on the variability in temperature, for example, across months.
------------------------------------------------
I actually tested the regression method by generating Weibull random deviates from a Uniform distribution of random numbers, indicated by Ui, as
supplied by the RAND() worksheet function, using the inversion method with supplied values of the parameters, in an accuracy determination exercise.
In the latter inversion approach employed in Monte Carlo methods (see https://en.wikipedia.org/wiki/Inverse_transform_sampling ), one replaces the F(x) by Ui and solves for Xi, assuming this can be performed. It can
be in the case of the two-parameter Weibull. I tested the methodology for a pair of parameters, k=1 and Lambda=1.5, and was satisfied with the
results. Here is a summary table over seven runs of 150 points each:
Parameter AVG: 0.98145883 1.448734814 (Note: Supplied parameter values are 1.0 and 1.5 )
Median: 0.9912668417 1.438871331
Avg Rank 1 & 7: 0.9716559998 1.416592451
Avg Rank 3 & 5: 0.9864466037 1.340333943
Avg Rank 2 & 6: 0.9813698805 1.444563933
Rank: k Parameter Simulation Rank Lambda
4/// 0.9912668417//// 2/// 1.320552039
5/// 1.017649631//// 1/// 1.241796556
6/// 1.042780621//// 6/// 1.568575826
1/// 0.8953570385//// 3/// 1.434384839
2/// 0.9199591396//// 7/// 1.591388347
7/// 1.047954961//// 5/// 1.54557476
3/// 0.955243576//// 4/// 1.438871331
[Edited on 26-11-2019 by AJKOER]
|
|
|
AJKOER
Radically Dubious
Posts: 3026
Registered: 7-5-2011
Member Is Offline
Mood: No Mood
|
|
Correction and added months:
My results for data from the months of DEC, JAN, FEB and MAR are as follows from fitting (by the regression method) a two-parameter Weibull
distribution:
Month /// k Parameter ///// Lambda
Dec /// 0.555 //// 4.373
Jan /// 0.972 //// 8.031
Feb /// 0.840 //// 9.084
Mar /// 0.571 //// 4.097
[Edited on 28-11-2019 by AJKOER]
|
|
|
AJKOER
Radically Dubious
Posts: 3026
Registered: 7-5-2011
Member Is Offline
Mood: No Mood
|
|
Historical Based Simulation of Total Snow Fall for NYC Total for 4 Months (NOV, DEC, JAN and FEB)
Actual Historical for 4 Months// Avg of 7 Simulation Statistics of 150 Winters // Simulation Run # > 1 2
AVG: 27.2, 30.8 // 30.4 31.3
MEDIAN: 25.4, 25.9 // 25.2 26.6
MAX 72.0, 119.3 // 105.1 133.4
MIN 2.8, 4.0 // 3.0 4.9
Continued....
Based on a Fitted Weibull Two-Parameter Distribution Using 150 Years of Data
Run > 3 4 5 6 7
35.1 29.7 32.7 33.3 30.2
27.4 25.5 28.2 27.9 24.8
196.7 93.9 152.3 129.7 114.6
3.3 3.4 2.5 2.7 1.9
Some observations, using tailored monthly Weibull distributions appears to produce an excellent agreement to the actual historical median and average
for the total 4 month snowfall for NYC. The only apparent deviation is at one tail relating to conceivable max values for snowfall which may be
alleviated by increasing the number of simulations from just seven. However, this could also be representative of the appropriateness of the
distribution selection (namely the Weibull), the fitting process itself (regression model method), or an independent assumption for extreme events, by
summing four values and ascribing the formed max, versus real-world possibly monthly negative correlations (relating to the consumption of water)
impacting the likelihood of an extreme snowfall total. Or, it could perhaps speak to the possibility of significantly heavier events that may yet to
occur in the future.
[Edited on 28-11-2019 by AJKOER]
|
|
|
clearly_not_atara
International Hazard
Posts: 2691
Registered: 3-11-2013
Member Is Offline
Mood: Big
|
|
The Weibull distribution traditionally models "lifetimes" and things that act like lifetimes.
It's also not the only right-skewed distribution that could fit that snowfall graph. Usually, if you're just looking at a graph and picking a
similar-looking distribution, you want to start with the simple ones, and the simple ones in this case are the log-normal distribution and the Poisson
distribution:
https://en.wikipedia.org/wiki/Log-normal_distribution
https://en.wikipedia.org/wiki/Poisson_distribution
From my intuition alone, snowfall seems like a Poisson distribution: you're measuring the number of times some event (a snowflake hitting the ground)
occurs (many) over a particular period of time (winter). These are sometimes called Poisson processes, which generally refers to anything
where you measure the number of random events occurring in some period.
However, in fact the Poisson model is too simple, and doesn't quite capture the fact that precipitation is actually two random variables: whether a
precipitation event occurs (which is Poisson distributed) and how much precipitation falls at once (which is gamma distributed). The gamma
distribution captures the fact that it is more likely that many snowflakes hit the ground at once rather than their being totally uncorrelated (a
silly oversimplification in my guess!). An analysis is given by Peter K Dunn:
https://rmets.onlinelibrary.wiley.com/doi/pdf/10.1002/joc.10...
So my guess would be, snowfall appears to follow a Weibull distribution just because the Weibull distribution is pretty similar to a Poisson-gamma
distribution, and snowfall is a Poisson sum of gamma-distributed snowfall events.
[Edited on 04-20-1969 by clearly_not_atara]
|
|
|
AJKOER
Radically Dubious
Posts: 3026
Registered: 7-5-2011
Member Is Offline
Mood: No Mood
|
|
Found a reference referring to the historical use of the Weibull in the field of hydrology. To quote from 'On application of the Weibull distribution
in hydrology' at
https://link.springer.com/article/10.1007/BF00421796 :
"The Weibull distribution, commonly used in hydrology, was derived using the principle of maximum entropy. The derivation required two constraints to
be determined from data and yielded, in turn, a unique procedure for estimation of the distribution parameters."
Also, from the 1st and 2nd page:
"To this end, the Weibull distribution is commonly used for frequency analysis as well as risk and reliability analysis of the frequently in hydrology
and meteorology. Grace and Eagleson (1966) fitted this distribution to the wet and dry sequences and obtained satisfactory results. Rao and Chenchayya
(1974) applied it to short-time increment urban precipitation characteristics in various parts of the U.S.A. and found satisfactory fit to the
durations of wet and dry periods as well as other characteristics.
.................
Entropy is a numerical measure of uncertainty or, conversely, the information content, associated with a pdf, f(x), used to describe a random variable
x. I(f) can be thought of as the mean value of -lnf(x)....The principle of maximum entropy was formulated by Jaynes (1961, 1982) to produce the
minimally biased distribution by maximizing entropy subject to given information."
Here is a link to a complete related advanced paper at https://bayes.wustl.edu/etj/articles/rational.pdf 'On The Rationale of Maximum-Entropy Methods', by ET JAYNES in PROCEEDINGS OF THE IEEE, 1982.
[Edited on 28-11-2019 by AJKOER]
|
|
|
Sulaiman
International Hazard
Posts: 3555
Registered: 8-2-2015
Location: 3rd rock from the sun
Member Is Offline
|
|
I have been doing a little research on wind power to supplement solar power for my planned new home.
For the best data analyses that I've found so far,
the best fit for wind speed is a Weibull distribution 
Maybe wind speed and snowfall are related ?
CAUTION : Hobby Chemist, not Professional or even Amateur
|
|
|
AJKOER
Radically Dubious
Posts: 3026
Registered: 7-5-2011
Member Is Offline
Mood: No Mood
|
|
Quote: Originally posted by Sulaiman  | I have been doing a little research on wind power to supplement solar power for my planned new home.
For the best data analyses that I've found so far,
the best fit for wind speed is a Weibull distribution
Maybe wind speed and snowfall are related ? |
Per my extract above:
"Rao and Chenchayya (1974) applied it to short-time increment urban precipitation characteristics in various parts of the U.S.A. and found
satisfactory fit to the durations of wet and dry periods as well as other characteristics."
One could modify the statement for wind as follows, "and found satisfactory fit to the durations of windy and calm periods as well as other
characteristics.'
which would be seemingly in accord with your observation. For support, a google search return several articles, for example, 'Modern estimation of the
parameters of the Weibull wind speed distribution for wind energy analysis' at https://www.sciencedirect.com/science/article/pii/S016761059... to quote the abstract:
"Three methods for calculating the parameters of the Weibull wind speed distribution for wind energy analysis are presented: the maximum likelihood
method, the proposed modified maximum likelihood method, and the commonly used graphical method. The application of each method is demonstrated using
a sample wind speed data set, and a comparison of the accuracy of each method is also performed. The maximum likelihood method is recommended for use
with time series wind data, and the modified maximum likelihood method is recommended for use with wind data in frequency distribution format."
and this abstract also at https://journals.ametsoc.org/doi/abs/10.1175/1520-0450(1978)017%3C0350:MFEWSF%3E2.0.CO;2 :
"The Weibull function is discussed for representation of the wind speed frequency distribution. Methods are presented for estimating the two Weibull
parameters (scale factor c and shape factor k) from simple wind statistics. Comparison is made with a recently proposed method based on the
“square-root-normal” distribution with mean wind speed and fastest mile data as input statistics. The Weibull distribution is shown to give
smaller root-mean-square errors than the square-root-normal distribution when fitting actual distributions of observed wind speed. Another advantage
of the Weibull distribution is the available methodology for projecting to another height the observed Weibull distribution parameters at anemometer
height."
This work 'The Estimation of the Parameters of the Weibull Wind Speed Distribution for Wind Energy Utilization Purposes' at https://www.jstor.org/stable/43749134?seq=1 actually likes the regression/graphical method. The first paper of the paper discusses a comparative
study among several alternative distributions and concludes the Weibull distribution renders the best fit to experimental data.
But why the Weibull? Because, to quote from my prior source above, the Weibull is able 'to produce the minimally biased distribution by maximizing
entropy subject to given information' or constraints, as could arise from the presence of rugged terrain.
--------------------------------------------
With respect to the use of wind energy for a home, I recall an instance where one 'stored' the wind energy by pumping a large pond of water to a
higher pond (providing a waterfall indoors), to be released as needed to generate energy. Both ponds were located in the expansive home, as likely in
some locales during cold months, ponds can be mostly turned into ice!
My wish list would have three possible heating (or cooling) sources of energy. One being conventional fireplaces/furnaces in areas with ample trees.
The last two are wind and a solar system, with the first two being able to fill the gap when there is no sunlight available. A smart home may be able
to switch between systems based on cost and expected/current supply inputs.
[Edited on 29-11-2019 by AJKOER]
|
|
|
Sulaiman
International Hazard
Posts: 3555
Registered: 8-2-2015
Location: 3rd rock from the sun
Member Is Offline
|
|
| Quote: Originally posted by AJKOER | | My wish list would have three possible heating (or cooling) sources of energy. One being conventional fireplaces/furnaces in areas with ample trees.
The last two are wind and a solar system, with the first two being able to fill the gap when there is no sunlight available. A smart home may be able
to switch between systems based on cost and expected/current supply inputs. |
That is almost exactly my plan 
except
- I will have no need for space heating, burning fuel will be mostly for cooking
- the fuel will be oil palm tree fronds (the hill which the house will be on is my brother-in-law's oil palm plantation)
- I plan to also have solar heated water
- photovoltaic power will be used to pump stored rainwater to a header tank for a decent outlet pressure
My big problem will be air-conditioning during darkness ...
We will have access to the internet, 3-phase electricity, bottled propane gas,
and at the bottom of the hill we will have piped mains water to a tank,
from which which we can pump water up to the house if required,
We will not be off-grid, just aiming for reduced grid usage,
with the option of being completely off-grid except for the air-conditioning.
All of this will casue a significant delay in me getting back to doing chemistry (and other hobbies)
and will change some aspects of how I do chemistry.
CAUTION : Hobby Chemist, not Professional or even Amateur
|
|
|
AJKOER
Radically Dubious
Posts: 3026
Registered: 7-5-2011
Member Is Offline
Mood: No Mood
|
|
A house on a hill in a region possibly characterized by significant rainfall season in a new century of likely significant global warming....what
could go wrong?
Unfortunately, I would be modeling rainfall distributions and probabilities of mudslides! Perhaps having access to a second home with low landslide
exposure should be considered in the planning as well.
My thoughts, even though a plantation on a hill has survived for over a 100 years, it may still be a matter for my peace of mind. Speaking to an
unbiased expert on earth movements may be advised.
|
|
|
|


