pH Indicator Chart – Colors and Ranges
Below is a colors and ranges chart for some pH indicators. Curiously most of the indicators have similar pH range of about 1.9 pH for the change in
color. The indicator with the sharpest color change is a combination of bromocresol green and methyl red requires only 0.5 pH change which is oddly
much narrower than either indicator.
I am very interested metacresol purple, unfortunately it is not shown in the chart. From other sources I estimate it requires a change of about 1.8ph.
The log scale of pH is compressing the change relative to the change hydrogen ion concentration, meaning a change of 2 pH is a change in hydrogen ion
concentration of 100.
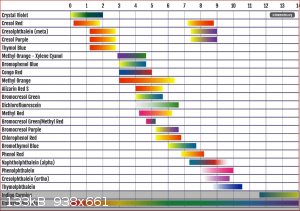
PS: Looking at the chart again cresol purple may be meta-cresol purple.
Source for the chart is https://sciencenotes.org/ph-indicator-chart-colors-and-range...
[Edited on 2/28/2022 by wg48temp9]
I am wg48 but not on my usual pc hence the temp handle.
Thank goodness for Fleming and the fungi.
Old codger' lives matters, wear a mask and help save them.
Be aware of demagoguery, keep your frontal lobes fully engaged.
I don't know who invented mRNA vaccines but they should get a fancy medal and I hope they made a shed load of money from it.
|