| Pages:
1
..
5
6
7
8
9
10 |
Marvin
National Hazard

Posts: 995
Registered: 13-10-2002
Member Is Offline
Mood: No Mood
|
|
Amazing progress. I'm a little ashamed I'm not further on myself.
This is probably not worth bothering with until every other source of noise has been minimised but this app note includes the chip noise reduction
method.
http://www.st.com/web/en/resource/technical/document/applica...
To address an old question from m1tanker78, I think the focusing objective is needed because it provides a way to couple a large percentage of the
Raman light to the spectrometer in a form that's well collimated. A diffuse source of large area would potentially lose orders of magnitude in
intensity coupling to the spectrometer.
|
|
|
m1tanker78
National Hazard
Posts: 685
Registered: 5-1-2011
Member Is Offline
Mood: No Mood
|
|
Quote: Originally posted by Marvin  |
To address an old question from m1tanker78, I think the focusing objective is needed because it provides a way to couple a large percentage of the
Raman light to the spectrometer in a form that's well collimated. A diffuse source of large area would potentially lose orders of magnitude in
intensity coupling to the spectrometer.
|
I see. If I collect the scattered light perpendicular to the laser axis, the collimator should be of short focal length in order to couple as much of
the scattered light as possible? In such an arrangement, what's to keep me from putting a reflector after the cuvette to recycle the 'wasted' laser
light that isn't absorbed by the sample? That is, reflect the laser beam back toward the sample to induce more scattering.
This may seem silly but it's bugged me for a while. What happens if the sample is placed inside of a reflective sphere with a small laser coupling and
small scattered light output coupler. Granted, this is just a thought exercise. Wouldn't this theoretical arrangement produce more spontaneous
inelastic scattering for the same laser power input? I would expect to see a very rapidly decaying string of harmonics centered around the laser line
(observed in the frequency domain).
Today, I mounted the CCD chip on a small PCB and mounted the PCB on a block that can be moved around inside the enclosure. I'm scraping together the
bits to first try the newer enclosure out as a regular spectrometer before painting the inside and making it (hopefully) light-tight. For the time
being, almost everything is or will be mounted in a fixture that will allow quick repositioning of individual components. If the spectrometer passes
muster, I'll add the filter assembly and try taking some Raman scans in the upcoming days. If not, back to the drawing board.
tvaettbjoern, I sure could use a nice linear stage like the one you 3D printed right about now. 
Chemical CURIOSITY KILLED THE CATalyst.
|
|
|
tvaettbjoern
Harmless
Posts: 28
Registered: 25-2-2016
Member Is Offline
Mood: No Mood
|
|
Thanks marvin, I will take a look the pdf. I'm waiting for a new pcb to arrive. It's probably not optimized for noise (I know virtually nothing about
proper pcb-layout), but the it's smaller so the leads are a lot shorter and the decoupling capacitors are closer to the IC's.
I tried changing my grounding scheme in accordance with ST's recommendation, but I saw little if any improvement.
m1tanker, I'd be interested to hear if you improve the signal reflecting the laser back into the sample. I imagine it could cause stability problems
if too much of the laser light makes it back into the laser (but I'm a chemist not a laser physicist). It would be great if it works so don't let me
stop you experimenting
|
|
|
m1tanker78
National Hazard
Posts: 685
Registered: 5-1-2011
Member Is Offline
Mood: No Mood
|
|
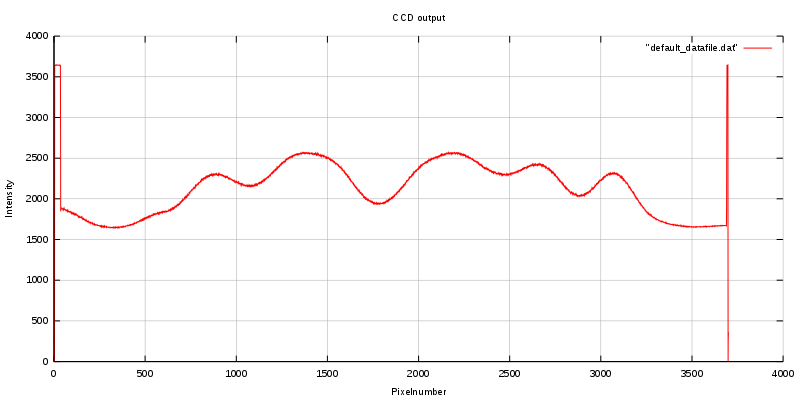
I was under the impression that the 'humps' on the graph came from a test pattern that you overlaid on the CCD window. Is that in fact the noise you
refer to?
Chemical CURIOSITY KILLED THE CATalyst.
|
|
|
tvaettbjoern
Harmless
Posts: 28
Registered: 25-2-2016
Member Is Offline
Mood: No Mood
|
|
No (good grief), no then I'd be worried. No the 'humps' is a photogram of the Thorlabs logo on a post-it I stuck on the CCD.
The noise is the width of the line. I don't have the data right at this second, so I can't say how much it's spread out. The ADC delivers values from
around 1500-3600, and a quick guess is that the deviation is around 25-50, which corresponds 1.5-2.5% (I really need to do proper statistics on it).
If I remember correctly the integration time for this "recording" was around 200 µs.
|
|
|
m1tanker78
National Hazard
Posts: 685
Registered: 5-1-2011
Member Is Offline
Mood: No Mood
|
|
| Quote: | | No (good grief), no then I'd be worried. No the 'humps' is a photogram of the Thorlabs logo on a post-it I stuck on the CCD. The noise is the width of
the line. [...] |
Thanks for clarifying that, I second-guessed and mistook it for a massive amount of AC being coupled in.
It turns out that the longer cable length was what caused the decrease in SNR that I observed. I attributed it to the longer sampling window but
debunked that after reverting to the shorter sampling window and testing. The only other thing I changed was the cable.
Here is a near-saturation scan that shows the higher noise level. The peak is a spider web strand [don't ask] that I strung across the glass:

Back to the drawing board..
Chemical CURIOSITY KILLED THE CATalyst.
|
|
|
Marvin
National Hazard
Posts: 995
Registered: 13-10-2002
Member Is Offline
Mood: No Mood
|
|
Some of the noise will be fixed pattern and some will be pixel to pixel sensitivity variation all of which would cause a thicker line when plotted at
10:1. This can be mathed away. An RMS measurement of a single pixel with a really steady light source would be a better test. A torch say.
How are you both wiring the output to the ADC, are you using a buffer to drop the source impedence?
|
|
|
tvaettbjoern
Harmless
Posts: 28
Registered: 25-2-2016
Member Is Offline
Mood: No Mood
|
|
Nice to know about the wirelength.
I'm using a buffer circuit identical to the typical drive circuit in the datasheet.
Rereading the datasheet I see there's something called "register imbalance". I'm guessing the odd pixels are moved to shift register 1, and the even
pixels are moved to shift register 2. The imbalance can be as high as 3% and it could account for some of the noise we're seeing.
It should be relatively easy to handle..
|
|
|
m1tanker78
National Hazard
Posts: 685
Registered: 5-1-2011
Member Is Offline
Mood: No Mood
|
|
Currently, the CCD output is driving a transistor which in turn drives the ADC -- identical to the datasheet. There does appear to be some odd/even
pixel differential. On the TCD1705, this was practically a constant value and could easily be nipped.
I ditched the buffer/inverter circuit some time ago and started driving the CCD directly. The buffer stage was necessary on the TCD1705 but not so
much on the 1304.
I'm going to incorporate a few smoothing schemes on the FPGA and test each one to make sure the signal isn't distorted. A 'triangular slide' works
fairly well on the PC, it just needs to be translated to hardware. There are many others that look promising but I haven't tested yet.
Chemical CURIOSITY KILLED THE CATalyst.
|
|
|
Marvin
National Hazard
Posts: 995
Registered: 13-10-2002
Member Is Offline
Mood: No Mood
|
|
I would avoid smoothing, it's throwing away information for the sake of making it more pleasing to the human eye. These sensors are capable of very
high quality measurements, less so the 1705, but the 1304 and others should be in the range of 60'000 to 100'000 electron well depth. Background
subtraction, bin width correction and frame integration should produce amazing data.
|
|
|
m1tanker78
National Hazard
Posts: 685
Registered: 5-1-2011
Member Is Offline
Mood: No Mood
|
|
Marvin, I completely understand your angle but I see no value in noise. A smoothed signal will be pleasing to the eye but more importantly, will make
for easier and more accurate peak detection which is what we're after. I agree that the sensor is capable of producing a clean signal. A good design
that exploits the capabilities of the sensor is primary to eliminating the need for invasive smoothing.
I swapped the 'video' output wire of the chip with an external wire (not within the cable that connects the other signals). I saw little or no
improvement in the noise floor. I'm going to double check the FPGA side of the design and make sure there aren't any phase mismatches or something I
overtly neglected on the last major revision of the firmware. It just seems like too much noise for making the cable a mere 6 inches longer.
Chemical CURIOSITY KILLED THE CATalyst.
|
|
|
m1tanker78
National Hazard
Posts: 685
Registered: 5-1-2011
Member Is Offline
Mood: No Mood
|
|
I tracked down some problems in the firmware. After correcting, the CCD frames look less noisy. Here is a super frame composed of 20 integrated frames
under tungsten desk lamp, wire lying on the sensor window (left) and a piece of cardboard suspended above the glass (right):

Looks much better than before. Spring break is upon us so progress will be slow or non-existent in the upcoming days.
EDIT: Resized image.
[Edited on 3-10-2016 by m1tanker78]
Chemical CURIOSITY KILLED THE CATalyst.
|
|
|
tvaettbjoern
Harmless
Posts: 28
Registered: 25-2-2016
Member Is Offline
Mood: No Mood
|
|
I would love to have such a clean signal. Can you reveal any details about what makes for a nice signal like this? Is there some secret regarding the
synchronization of the ADC with the output, or is it simply a matter of averaging, or is it something else entirely?
I've made no attempts of ensuring that the ADC is sampling in the "middle" of each pixel, but it is possible to tune this.
As far as I know I'm in accord with the timing requirements, but I've made no efforts to ensure that ICG goes high when fM is high, I should see if it
has anything to say.
|
|
|
Marvin
National Hazard
Posts: 995
Registered: 13-10-2002
Member Is Offline
Mood: No Mood
|
|
A tungsten bulb running from the mains will have some flicker. The sensors should have something like 300:1 signal to noise.
|
|
|
m1tanker78
National Hazard
Posts: 685
Registered: 5-1-2011
Member Is Offline
Mood: No Mood
|
|
tvaettbjoern:
There's no secret. The last graph I posted is the result of integrating 20 individual frames. I haven't had any luck obtaining very clean individual
frames like I did when the sensor was close to the FPGA (see upthread). The longer wires undoubtedly add much noise. The graph does however show that
the corrections I made on the FPGA eliminated most of the periodic noise that cropped up after the firmware revision -- even when integrating 5,000
shapshots.
Could you store at least 5 frames on the PC and then literally add them together? Graph the result, adjust so that the upper bound of the graph is
slightly higher than the highest value dummy pixel. Adjust the lower bound of the graph to be slightly less than the lowest value valid image pixel.
It's always a good idea to place something on the glass for contrast. Compare the result to any individual frame. White (random) noise tends to
flatten out while noise caused by synchronous/clocked events (state machine(s), ADC, etc) tend to be accentuated. It's just a quick qualitative test
that will hopefully help you decide where to start looking to fine tune. Honestly, the graph you posted looks really good for being a single frame
with no averaging.
Marvin:
The tungsten lamp is probably the most stable light source I have in my house. Virtually every other source tends to flicker horribly. I haven't even
touched on taking readout/background noise frames and subtracting them from valid image frames yet. Could you elaborate on bin width correction?
Chemical CURIOSITY KILLED THE CATalyst.
|
|
|
Metacelsus
International Hazard
Posts: 2531
Registered: 26-12-2012
Location: Boston, MA
Member Is Offline
Mood: Double, double, toil and trouble
|
|
Why not try an LED light source (powered by DC, of course)? That shouldn't flicker at all.
|
|
|
Marvin
National Hazard
Posts: 995
Registered: 13-10-2002
Member Is Offline
Mood: No Mood
|
|
What I'm thinking of as bin width is covered in the datasheet as pixel sensitivity variation. So the process would be exposing the CCD to a very
diffuse light source almost to full wells and then mathing. Nothing you've not thought of I imagine. Whereas dark noise is going to depend on the
temperature, exposure etc and must be done 'live' I'd be hoping per pixel sensitivity data is constant for the device. It may be more practical to do
this when the optical bench is done and have it cancel out any shadows, optical flaws etc too.
I have ordered some 1304's but I have no idea when they will arrive.
|
|
|
m1tanker78
National Hazard
Posts: 685
Registered: 5-1-2011
Member Is Offline
Mood: No Mood
|
|
| Quote: Originally posted by Marvin | | What I'm thinking of as bin width is covered in the datasheet as pixel sensitivity variation. So the process would be exposing the CCD to a very
diffuse light source almost to full wells and then mathing. [...] |
Ok, you're talking about the pixel-to-pixel PRNU. When you mentioned 'bins' I immediately thought of Fourier transform with variable width bins. The
datasheet outlines how to calculate the absolute value of maximum deviation against the frame average. I have the formulae to calculate individual
pixel deviation but haven't gotten around to 'translating' that to hardware. The sign of each pixel deviation must obviously be known.
I estimate that the overall pixel-wise PRNU will be very low (not nearly the 10% maximum the DS quotes). There will no doubt be significant roundoff
error when applying a pixel-wise correction for PRNU.
Hopefully you ordered a few. Of the ~8 1304's I've ordered, only 3 operate normally. One of them had condensation inside the chip. Another
one had a coating on the inside of the glass that looked as if it were vacuum metalized on one side. The rest were hit or miss, some DOA. A couple of
them appeared to have been desoldered (not new, old stock as claimed).
An LED (with collimator) would be great. I like the goose neck and articulating head on the desk lamp. I use a keychain LED for testing when I have a
free hand.
[Edited on 3-11-2016 by m1tanker78]
Chemical CURIOSITY KILLED THE CATalyst.
|
|
|
Marvin
National Hazard
Posts: 995
Registered: 13-10-2002
Member Is Offline
Mood: No Mood
|
|
Oh :/
I ordered two from the cheapest supplier I could find on ebay, aquawayindustrial.
Would you mind sharing where you ordered from?
|
|
|
tvaettbjoern
Harmless
Posts: 28
Registered: 25-2-2016
Member Is Offline
Mood: No Mood
|
|
I've bought a couple of TCD1304DG's from goodtronic. They were both good.
I bought 10 cheap TCD1304AP's from aquawayindustrial. I've not been through all of them, but they appear good. They are definitely used (scratches on
some of the pins), and small Newton rings are visible at the edge of the window (indicating slight separation between the glass and the frame).
The graph I posted earlier was made with a TCD1304AP from aquawayindustrial
|
|
|
tvaettbjoern
Harmless
Posts: 28
Registered: 25-2-2016
Member Is Offline
Mood: No Mood
|
|
I just ran the whole lot through a very small check. All eleven chips work (I broke the OS-pin on the 12th some time ago, so it's officially retired).
There's slight variance of output signal voltage, but nothing surprising.
|
|
|
m1tanker78
National Hazard
Posts: 685
Registered: 5-1-2011
Member Is Offline
Mood: No Mood
|
|
Hmm.. aquawayindustrial doesn't ring a bell. I bought mine from various sellers on ebay (lowest price -- China).
I performed a quick bare-bones test of the new testbed today. The paint, gaskets and baffles are still pending. I believe there's a bug in my Windows
application. I think the problem might be in the function that unpacks the incoming stream. Notice the missing data points at the far left and the
uniform 'shoulders' on the peaks that extend down past a certain value.
I pointed the spectrometer port of the enclosure at a CFL and discovered that the CCD is in the wrong spot. It only captured green and above. I'll
track down the bug and get the testbed ready for better testing next week.

Chemical CURIOSITY KILLED THE CATalyst.
|
|
|
tvaettbjoern
Harmless
Posts: 28
Registered: 25-2-2016
Member Is Offline
Mood: No Mood
|
|
Here are 5 readings averaged. It certainly cleaned things up a bit (a single frame has noise comparable to the previously attached graph).
The integration time for each frame here is 8.6 ms, as it's evening now (and we're still looking at thorlabs' logo).
I'm in the process of making a spectrophotometer in parallel to my work on the raman spectrometer. I have no idea what integration times I will end up
with with the spectrophotometer, but averaging will be much more convenient here.

I used to do a lot of work with NMR and with one of the old machines, that people didn't exactly queue up for, I would sometimes "average" up to 32000
recordings (typically 1-8 s pr collection). As the hours would pass you could see the signals slowly rise above the noise, so clearly this was not
simply an average. Any thoughts on how that's done?
I would imagine it's a matter of precisely zeroing in on the center of the signal (which would be almost exclusively noise) and summing rather than
averaging. But to be honest I was more consumed with my molecules than the NMR-spectrometer, so I never gave it much attention..
Anyway, it might not be interesting for Raman spectrometry. As far as I understand from the literature you get a bet signal from a 25s integration
than 5x 5s integrations because of the CCD readout noise.
|
|
|
Marvin
National Hazard
Posts: 995
Registered: 13-10-2002
Member Is Offline
Mood: No Mood
|
|
Integration should be done after all other fixable sources or noise have been minimised. It's not quite an average, there is no point dividing by a
number, just add the bins together making sure they don't overflow. The signal then gets a sqrt(n) improvement relative to noise, where n is the
number of frames added. Depending on what the gain is doing during that process either the noise drops or the signal grows from nothing. 30 secs is
supposed to be as much as you can push the Toshiba chips to without degrading the output excessively, but it will depend on temperature. They may
leak their way to empty wells from dark current if left much longer.
FWIW I never had access to an NMR, but I was exactly the same with IR machines. Everyone else was queuing to use the FTs and I was the only one using
the dual beam machines.
m1tanker78, any luck with your decompression artefacts?
|
|
|
m1tanker78
National Hazard
Posts: 685
Registered: 5-1-2011
Member Is Offline
Mood: No Mood
|
|
I looked through the FPGA modules as well as the application code. Everything looks OK. It's possible that the 'shoulders' on the peaks were
reflections between the CCD glass and final mirror (or just bad focusing). Time and experimenting will tell.
I plugged the laser module into the specto. port today to try and gain some knowledge of the raw laser characteristics. Up until today, I'd only
viewed the filtered laser spectrum through a spectroscope. Even running the CCD at highest frequency and lowest allowable integration time, the sensor
would saturate and distort the beam shape and spectrum. To combat, I placed an attenuator between the laser module and the spectrometer.
In case you're wondering why I didn't simply lower the laser power, I specifically wanted to test the laser module slightly over-driven. I've read a
few references that say that solid state lasers tend to go unstable when overdriven.

I reassembled the CCD eye and shifted it over so that the red part of the spectrum falls near the end. Using the terbium lines of a prior test with a
CFL, I roughly calculated the FWHM specral spread of the laser line to be around 1.3nm. The CCD eye probably needs some fine adjustment on the focus
but the width of the laser line would be the limiting factor of resolution in this scenario. It actually doesn't look as bad as I envisioned. That
should somewhat relax the requirements of the laser monochromator module.
Next up will be figuring out the laser wavelength and quantifying how much the line wanders over time, temperature and power. I'm also going to begin
work on the DAC soon to precisely control the laser power. Oh and I'm almost ready to paint the box and install gaskets, beam dumps, etc.
Chemical CURIOSITY KILLED THE CATalyst.
|
|
|
| Pages:
1
..
5
6
7
8
9
10 |