Metacelsus
International Hazard

Posts: 2531
Registered: 26-12-2012
Location: Boston, MA
Member Is Offline
Mood: Double, double, toil and trouble
|
|
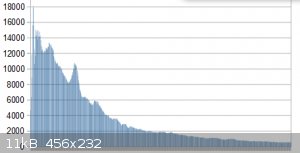
Baseline correction algorithm for Raman spectra?
I've done some research, but I don't really understand how to implement baseline correction. I've tried Fourier transforms with a high-pass filter,
but that doesn't work very well. Apparently, there's a polynomial interpolation algorithm to find the baseline and subtract it, but again, I don't
know how to implement it.
The spectrum in question:
[Edited on 28-5-2015 by Cheddite Cheese]
|
|
|
smaerd
International Hazard
Posts: 1262
Registered: 23-1-2010
Member Is Offline
Mood: hmm...
|
|
FT high pass filter will not even out a baseline or anything like that without large losses. It would be nice if the baseline was off by a single
harmonic function though.
I guess the first question is, how are you handling your data? This is an incredibly relevant question because different environments have very
different tools. EX: MatLab, Origin, Excel, R, JAVA/C/etc? Baseline correction algorithms aren't the easiest things to implement usually.
Does your bad baseline correspond to a 'background spectrum'? Meaning is it consistent through out your samples.
I'm happy to see you're collecting spectra now  . IIRC radagast was having this
issue. . IIRC radagast was having this
issue.
Edit - Would this be of help? https://code.google.com/p/baselinewavelet/  . They seem to be using one of
the state of the art algorithms here with a "Continuous Wavelet Transform". This should definitely help you get started or just implement it directly
in your project and give due credit. . They seem to be using one of
the state of the art algorithms here with a "Continuous Wavelet Transform". This should definitely help you get started or just implement it directly
in your project and give due credit.
[Edited on 29-5-2015 by smaerd]
|
|
|
Metacelsus
International Hazard
Posts: 2531
Registered: 26-12-2012
Location: Boston, MA
Member Is Offline
Mood: Double, double, toil and trouble
|
|
I saw that package already, but I don't have any experience with R. I've been doing stuff in Octave, which is an almost identical open-source version
of MATLAB. My spectroscope code is written in C, so I could also easily implement something in that language.
I think the baseline is partially due to fluorescence, and partially due to stray light. It is generally consistent in shape, but the magnitude varies
widely, and the width varies somewhat.
[Edited on 29-5-2015 by Cheddite Cheese]
|
|
|
smaerd
International Hazard
Posts: 1262
Registered: 23-1-2010
Member Is Offline
Mood: hmm...
|
|
hmmmm, I think you're right it sounds like fluorescence to me, but I'm no expert.
Cool I use octave too. If you can utilize Octave it will save you a ton of trouble writing dozens of mathematical operations in libraries/classes.
Well what you're gonna be doing is Wavelet Analysis. There's kinda good news and bad news here.
A lot of the methods people have done for this type of thing are part of PhD projects/thesis, or publications (they take a while to create from
scratch). It's not easy to do this sort of thing homebrew. It's kind of a matter of citing someones algorithm and hard-coding it, or citing someones
code and implementing it (to my understanding). It's totally possible to do either, but I wouldn't reinvent the wheel and I don't know how many people
would be willing to help come up with a novel way to do this. Someone to ask might be the guy who built that zaney rPi Raman, or peak at his code.
The good news is MATLAB and octave are pretty interchangeable. There's some code people have shared for matlab for this problem. The most concise
example I've found with some pretty intelligeable code is this http://www.mathworks.com/matlabcentral/fileexchange/27429-ba... It's a different approach from the R code (it makes sense and is documented with
comments) but it does show how they are handling the polynomial sums. Again, due credit would need to be given.
Another option would be to find a way to port the R code to C/C++ or to Octave/Matlab. Or just run R directly from your C/C++ which is totally
possible. The reason why I say that is because that R example was pretty darn slick.
Edit - and of course I'm sure you already know, it's pretty easy to call octave commands from C/C++ as well.
[Edited on 29-5-2015 by smaerd]
|
|
|
Metacelsus
International Hazard
Posts: 2531
Registered: 26-12-2012
Location: Boston, MA
Member Is Offline
Mood: Double, double, toil and trouble
|
|
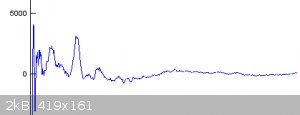
The MATLAB package works pretty well, although it takes a bit of work to get it to run in Octave (Octave doesn't support nested functions, so I had to
un-nest them).
|
|
|
smaerd
International Hazard
Posts: 1262
Registered: 23-1-2010
Member Is Offline
Mood: hmm...
|
|
Looks pretty good! I'm sure it could be better, but hey, those are peaks! I'm not sure what's happening all the way over on the far far left though.
Edit - nevermind I see whats happened in the original spectra had to zoom in.
[Edited on 29-5-2015 by smaerd]
|
|
|
aga
Forum Drunkard
Posts: 7030
Registered: 25-3-2014
Member Is Offline
|
|
Sorry if this seems dense :-
Would one not simply take a blank scan then subtract those values from the sample scan ?
Or vice versa (nobody likes negatives)
[Edited on 29-5-2015 by aga]
|
|
|
smaerd
International Hazard
Posts: 1262
Registered: 23-1-2010
Member Is Offline
Mood: hmm...
|
|
If it's sample fluorescence then a background subtraction won't do much good. If it's just a background type off-set then sure.
|
|
|