dhaffnersr
Harmless

Posts: 30
Registered: 29-3-2016
Location: Hopewell VA
Member Is Offline
Mood: always cool and calm...
|
|
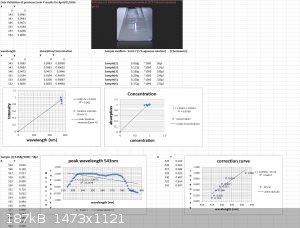
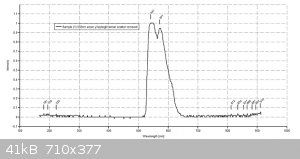
Data Validation of previous Eosin Y results for April/21/2016
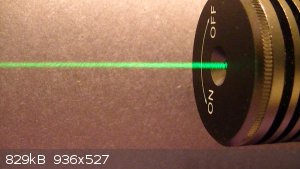
Using my Aries series green laser, I wanted to validate the Eosin Y study I did the other day with the Prolight Uv LED (410nm). I'm presenting this
study as a final result for this series of tests using my plab v2.5 spectrometer (build 3.0)
Sample preparation:
2 cuvettes, one for the Blank (0.1M NaOH in 20 % ethanol) and one for samples S1 thru S6.
Volume capacity calculations- 1 drop of eosin y (1 % aqueous solution) = 0.058g
To convert to micro liters take 0.058g*1000 = 58 microliters
Sample(1)-1 drop 58 microliters
Sample(2)-2 drops 127 microliters
Sample(3)- 3 drops 189 microliters
Sample(4)- 4 drops 254 microliters
Sample(5)- 5 drops 320 microliters
Sample(6)- 6 drops 372 microliters
Each scan will last 30 seconds.
Excitation source- 532nm Aries series green laser (20mW)
|
|
|
dhaffnersr
Harmless
Posts: 30
Registered: 29-3-2016
Location: Hopewell VA
Member Is Offline
Mood: always cool and calm...
|
|
More on my research can be found here:
http://publiclab.org/profile/dhaffnersr

|
|
|
nezza
Hazard to Others
Posts: 324
Registered: 17-4-2011
Location: UK
Member Is Offline
Mood: phosphorescent
|
|
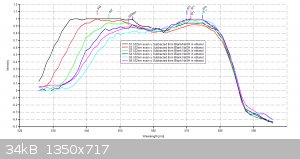
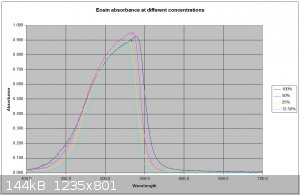
Interesting work, and some of your publiclab studies look good as well. I have recently been doing some spectrometry (Not as comprehensively as
yourself) on some fluorescent dyes including Eosin Y. The spectrometer I use is a science-surplus unit using spectrum studio software. Using a white
light source to generate an absorption spectrum I find a spectrum shift on fluorescent materials with concentration. I am assuming this is due to some
self fluorescence from the dye caused by the white light source. I know Eosin's maximum absorption is in the green so I will try to obtain an
emission spectrum of the dye. I have attached a plot of the curve at different concentrations. I suspect a scanning spectrophotometer using
monochromatic light would be the best way to obtain a true absorption spectrum.
If you're not part of the solution, you're part of the precipitate.
|
|
|
dhaffnersr
Harmless
Posts: 30
Registered: 29-3-2016
Location: Hopewell VA
Member Is Offline
Mood: always cool and calm...
|
|
Hey nezza, nice plot. Remember that at higher sample concentrations your going to start suffering the "inner-filter" effect, I usually start with 6
different sample concentrations, this usually gives the best calibration curves.
Yes, you are correct about using the monochromatic light, I use a UV laser (405nm) and a green laser (532nm) for my excitation light sources.
|
|
|
nezza
Hazard to Others
Posts: 324
Registered: 17-4-2011
Location: UK
Member Is Offline
Mood: phosphorescent
|
|
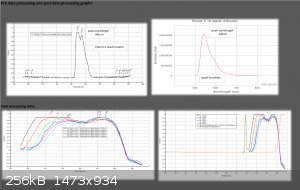
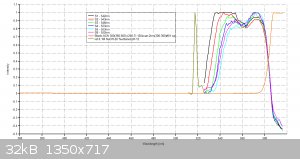
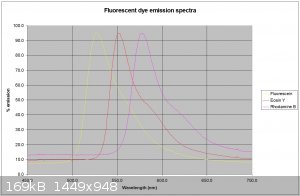
Thanks for the info. I have attached my traces of 3 dyes using a 405nm laser for the fluorescein and a 532nm laser for the other 2. Th traces are much
cleaner.
If you're not part of the solution, you're part of the precipitate.
|
|
|
dhaffnersr
Harmless
Posts: 30
Registered: 29-3-2016
Location: Hopewell VA
Member Is Offline
Mood: always cool and calm...
|
|
hey nezza
very clean, what are the peak wavelengths? curious because I have to use Plab's spectral workbench 2.0 software online to run my hardware to capture
spectra and they run java script, and I think there are inconsistencies in my results due to the way they average the pixels.
|
|
|
nezza
Hazard to Others
Posts: 324
Registered: 17-4-2011
Location: UK
Member Is Offline
Mood: phosphorescent
|
|
Hi Dhaffnersr
The values I get are :-
Fluorescein - 528nm
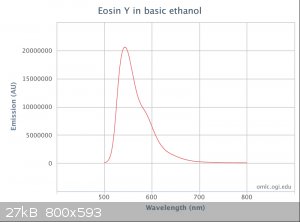
Eosin Y - 551nm
Rhodamine B - 577nm
All dyes dissolved in basic (0.1M NaOH ethanol)
If you're not part of the solution, you're part of the precipitate.
|
|
|
dhaffnersr
Harmless
Posts: 30
Registered: 29-3-2016
Location: Hopewell VA
Member Is Offline
Mood: always cool and calm...
|
|
Not too bad ezza, I see you are using the NaOH/ethanol buffer, I have been experimenting with that because of the higher pH. My solution is 0.1M NaOH
and 20% ethanol with a pH of 12, I did have to adjust the sample concentrations though, for the Rhodamine B I had to use the 100ppm an 100ppb
standard, for the Eosin Y- samples 1 thru 6 were-58microlitres to 372microlitres, for the fluorescein it was 11microlitres to 77microlitres.
My peaks were- fluorescein-517nm-543nm, Eosin Y-543nm, Rhodamine B-565nm at 100ppm.
here is a great reference site to use for comparisons-
http://omlc.org/spectra/PhotochemCAD/html/010.html
They have many spectra with raw data included.
|
|
|