Square Wave Voltammetry Simulation
Because, I always thought electrochemistry was Oh-So-Fascinating I learned some of it's basic principles/applications. Interestingly electrochemistry
is one of the types of chemistry which can be modelled quite easily and 'well' via simulation. One of my favorite applications is Square-wave
Voltammetry (SWV). .
In the holiday spirit I figured I'd share some code with you all  . .
Here's a SWV simulation function written in R which I adapted from a publication written in MATHCAD (Bulletin of the Chemists and Technologists of
Macedonia, Vol. 18, No. 1, pp. 57–64 (1999)). Keep in mind this simulation is not the complete story and exhibits a good deal of
simplifications/approximations but it's good enough to get the ball rolling.
Attachment: square.wave.R (3kB)
This file has been downloaded 1183 times
I am also including a few small examples which demonstrate how the function can be used. The first uses the same kinetic parameters except changing
diffusion based mass transfer (diffusion constant) in situations of say increasing binary solvent concentration.
Attachment: diffusion tests2.R (845B)
This file has been downloaded 1150 times 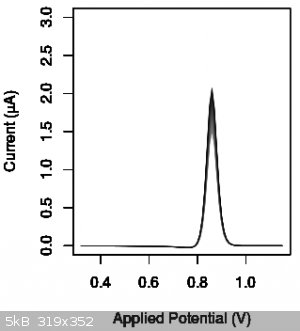
The second examines the effect of charge transfer coefficient (α) and heteregeneous rate constant (k) on peak current. This is a simple theoretical
way to try to find scan-rates that will produce quantitative data from peak current (height) in many samples with different environments/conditions.
For the uninitiated this simply means that the kinetic parameters (α, k) both change the observed peak height(amps) for a given analyte.
Interestingly, these parameters are also effected by the scan rate (volts/second). So if there is a range of kinetic parameters where the peak current
is effectively constant (flat) then the scan rate which induces the kinetic parameters to be in the constant "domain" is ideal for use to obtain
quantitative information.
Attachment: K and alpha variance on current.R (3kB)
This file has been downloaded 1139 times 
Anyway, hope this helps someone out. It was fun doing it. Be kind, R is not my native language but it is free and widely available for all operating
systems. Feel free to modify and use the code but do include the reference(my code is VERY SIMILAR to that of the mentioned article).
There are a few small hiccoughs in the code. I am sure of that . Again, feel free
to modify, improve, adapt, and upload changes or interesting uses for it.
[Edited on 26-12-2015 by smaerd]
[Edited on 26-12-2015 by smaerd]
|