| Pages:
1
2
3 |
zoomer
Hazard to Self

Posts: 66
Registered: 22-3-2005
Location: Watching the sun set over the saguaros
Member Is Offline
Mood: Always Curious
|
|
Overdriving an LED will kill it
woelen, way cool project, I hope it works out. My 2c:
While overdriving an LED (forcing more current than it's made for) will indeed modify the output wavelength slightly, it dramitically shortens
the lifespan of the devise, as in it may last days instead of years. Since you would need to recalibrate every time you replaced an element, I doubt
the small variation would be worth it.
A few other LED operation notes:
- All LEDs are made the same way, with simple processes and cheap materials. Between any two similar types, the difference in price comes from
testing. Testing of an individual device is the only way to know it's actual characteristics since it cannot be determined with much accuracy
before manufacture. Generally, the more expensive a semiconductor, the closer it is to nominal specifications. Some are even sold
"certified" where you are given the actual test results for specific device you bought. They are very expensive, US$5-$10 apiece, but may
be worth it in this application since that info is critical to you.
- "White" LEDs are really just a blue, green, and red LED on the same die, so in a spectrograph it would have 3 narrow bands, instead of the
nice broadband output that you are looking for.
Z
|
|
|
Marvin
National Hazard
Posts: 995
Registered: 13-10-2002
Member Is Offline
Mood: No Mood
|
|
As has been indicated you can overcurrent an LED without burning it out by very rapid pulsing. The peak current gets you the wavelength shift, the
overall power usage determines the lifespan, provided the switching is fast enough. I'm surprised the shift is that much, I'd have though
the colour change would be due to unwanted bands apearing in the spectrum, rather than a shift and I'm still pretty convinced thats what is going
on witht he green LED turning orange.
White LEDs are generally not 3 colours in the same case, but a blue LED with a broadband phosphor.
Semiconductor lasers have a very narrow bandwidth, and can be tuned very slightly by altering the temperature. Cavity modes are a problem with this
method but a red laser diode might be tunable by about 10nm over a 40degree range.
|
|
|
IrC
International Hazard
Posts: 2710
Registered: 7-3-2005
Location: Eureka
Member Is Offline
Mood: Discovering
|
|
When pulsing be sure to tailor the waveshape and amplitude correctly as the crystal structure can deform or crack, from a piezo type electro
mechanical effect. I used to build power supplies for laser diodes for Meredith Instruments and I learned the hard way as this was almost 20 years ago
and damn those diodes were expensive back then.
|
|
|
woelen
Super Administrator
Posts: 7976
Registered: 20-8-2005
Location: Netherlands
Member Is Offline
Mood: interested
|
|
| Quote: | Originally posted by Quibbler
I've just re-read the specs on your LEDs
12000cd you might want to consider making a death ray instead. And are you sure that the band width is 1 nm you would be lucky to get that from a
laser diode.
|
Sorry for me being off a factor of 1000   . Indeed not very smart. Of course, I meant 12000 mcd. . Indeed not very smart. Of course, I meant 12000 mcd.
See for example:
http://stores.ebay.de/Michis-LED_LED-Weis_W0QQcolZ2QQdirZ1QQ...
They have many LED's of different colors and the non-whites are specified with the central wavelength mentioned. Brightness is between 5000 and
12000 mcd (not cd )
|
|
|
Quibbler
Hazard to Self
Posts: 65
Registered: 15-7-2005
Location: Trinidad and Tobago
Member Is Offline
Mood: Deflagrated
|
|
I made a mistake too only a factor of two though. My half height widths should be 26 nm (not 13 nm).
I'm pretty sure that if you don't have the over current on for too long not much damage will be done. I am assuming it is the heat
disappation that does the damage?
My worry is that Beer-Lambert law only works for monochromatic radiation it's because of the logarithmic stuff it there. But with an LED we know
(roughly) what the shape of the emission is (Gaussian maybe?) so if enough points are collected it should be possible to work back to monochromatic.
I find that the following has the largest range of LEDs. They cover those difficult regions 660-880 and 460-520.
http://www.roithner-laser.com/LED_diverse.htm
|
|
|
unionised
International Hazard
Posts: 5102
Registered: 1-11-2003
Location: UK
Member Is Offline
Mood: No Mood
|
|
The Beer Lambert law fails with non- monochromatic radiation, but it isn't to do with the logs in it.
Imagine that you are trying to measure some red chemical by seeing how much green light it absorbs. Unfortunately, your green (monochromated) light
isn't as good as you think it is, for example let's say it has some small amount of red light in it. As you increase the concentration of
the dye it absorbs more and more of the green light and so less light gets through to the detector. On the other hand, the red light goes through the
dye without any problem.
No matter how much dye you put in the solution the detector will never see "zero" light - the closest it will get is when (virtually) all
the green light is absorbed by the red dye and all it sees is the red light.
If you plot out the LOG(absorbance) versus the concentration the line will not be straight- it will be close at moderate concentrations but it will
look like a failure of the B-L law.
The effect is still present (of course, it's smaller), even if the "wrong colour" light is almost the same wavelength as the
"right" wavelength, and that's what you have with non monochromatic light.
You can to some extent avoid this problem by measuring the absorbance at a wavetength where the rate of change of absorbtion with wavelength is small.
Normally this means a peak in the absorbtion spectrum but a valley works well too.
(There are similar problems with "stray light" . .
|
|
|
Quibbler
Hazard to Self
Posts: 65
Registered: 15-7-2005
Location: Trinidad and Tobago
Member Is Offline
Mood: Deflagrated
|
|
I'm sure you meant LOG(transmission) against conc. - absorbance is already logged. OK it is an extreme example you have chosen even if the spread
of wavelength is such that the molar absorption coeff is different over the wavelength range B-L law will not work. And I'm still sure its
because absorbance is proportional to conc, but absorbance is LOG(transmission) so the extinctions do not add nicely.
I guess this really does not matter if you just want a pretty graph abs vs wavelength. KMnO4 is a nice one to try it's the only compound
i've found with a marginally interesting visible spectrum.
|
|
|
unionised
International Hazard
Posts: 5102
Registered: 1-11-2003
Location: UK
Member Is Offline
Mood: No Mood
|
|
Oops! Yep, my mistake.
NdFeB magnets disolve in acid (you only need a little one). Nd+++solutions have another relatively interesting spectrum.
If you want to leave the inorganics behind, carotene and chlorophyll are quite interesting too.
Some of the polycyclic aromatics have nice UV spectra but they are in the UV (not to mention the toxicity of some of them).
|
|
|
frogfot
Hazard to Others
Posts: 212
Registered: 30-11-2002
Location: Sweden
Member Is Offline
Mood: happy
|
|
Holy cow! What about a homemade HPLC coupled to UV detector? Seems to be easy to make in theory, using silica or cellulose column. There's
probably a thread on this.
Just to be on topic, using the standard (commersial) LEDs in homemade spectrometer would be a good way to characterise the compounds among
madscientists 
Say, people can report prepared compounds having absorbtions at specific wavelengths.. mm
[Edited on 3-12-2005 by frogfot]
|
|
|
Tacho
National Hazard
Posts: 582
Registered: 5-12-2003
Member Is Offline
Mood: No Mood
|
|
I agree that a standart simple homebuilt spectrometer would be great for amateurs to compare their results. I have a few doubts that LEDs will do the
job, though. Their band of emmission seems too broad, usually 50nm. Check this from I-am-a-fish link:
http://ledlights.home.att.net/spectra/660.gif
http://ledlights.home.att.net/spectra/spec5.gif
http://ledlights.home.att.net/spectra/orange.gif
http://ledlights.home.att.net/spectra/etggrn.gif
I stoped working on my idea, because I became too interested in Ranque-Hilsch vortex tubes. But, since anyone trying to build an spectrometer is
probably going to face some mechanical chalenges, I post the picture and description of my constant light device, because I think the idea is pretty
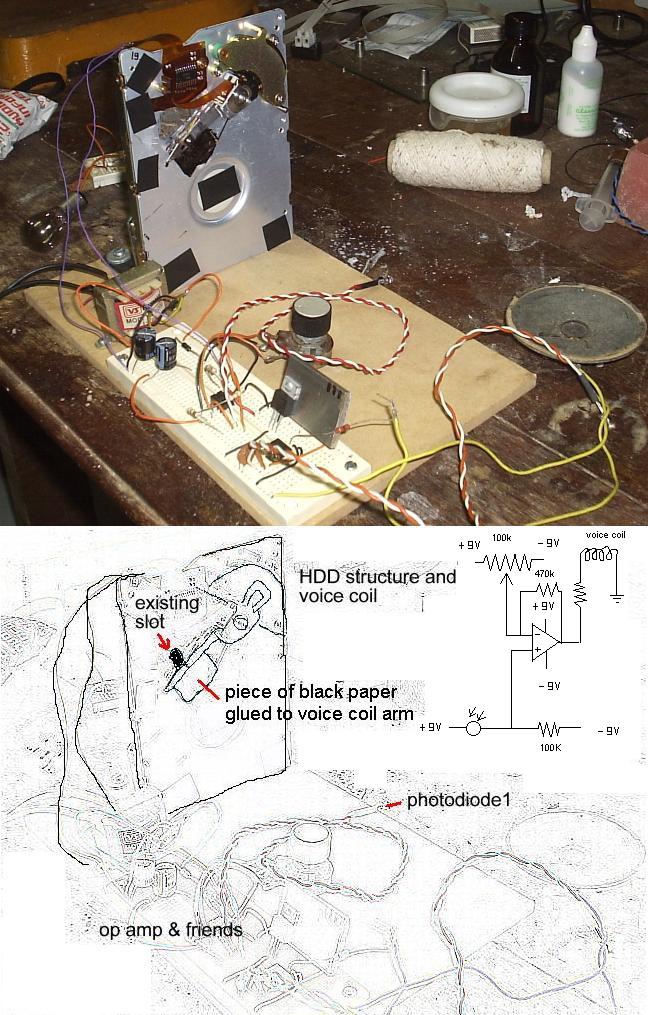
neat and may have other uses for hardware hackers. I used a broken HDD chassis to do 90% of the work for me.
The HDD has an arm that moves the heads from track to track. The arm is driven by a coil in between magnets, so that depending on the direction of the
current flowing, it goes back and forward. It's not hard to identify the wires that connet to the coil and make a direct connection to the circuit.
Usually the arm has one beam for each disk. I tore away the unwanted ones.
The chassis already had an oblong slot that I used as a light passage. A photodiode on the other side (in the picture it's not fixed, it's loose for
tests) senses the light and feeds a op-amp (classic design) voltage comparator: Too much light and the current flows in one direction, pulling the
voice coil arm and shutting the light slot; when too little ligth passes, current reverse its flow, opening the light slot.
Initially it had some vibration, but a 470K ohm feedback resistor made it firm as a rock.
A piece of black paper/foil had to be glued to the arm to make it able to totally close the slot.
The extra circuit you see on the bottom/center of the picture is a 555 based circuit that changes frequency with light changes on photodiode 2 and
would be used in the future as the sample sensor- right now it's just connected to a loudspeaker so I can hear it tick. Literally.
I closed the other holes in the chassi with black electric tape, hence the black squares all over the picture.
|
|
|
jimwig
Hazard to Others
Posts: 215
Registered: 17-5-2003
Location: the sunny south
Member Is Offline
Mood: No Mood
|
|
Here is what I consider to be excellent how to concerning various spectro type devices.
They are all Scientific American magazines. Available all the over library spectrum of the world.
Spectrograph, astronomical,
1956 Sep, pg 259
Spectrograph. auroral,
1961 Jan, pg 177
Spectrograph. Bunsen's,
1955 June pg 122
Spectrograph. how to make a diffraction-grating type,
1966 Sep, pg 277
Spectrograph, ultraviolet. construction of,
1968 Oct, pg 126
Spectroheliograph. how to make,
1958 Apr, pg 126
Spectrohelioscope. how to construct,
1974 Mar, pg 110
Spectrometer. beta-ray,
1958 Sep, pg 197
Spectrometer. magnetic-resonance,
1959 Apr, pg 171
Spectrometer. mass. how to construct,
1970 Jly, pg 120
Spectrophotometer, construction of,
1968 May, pg 140
Spectrophotometer, recording, how to construct,
1975 Jan, pg 118
Spectroscopy of candle flame,
1978 Apr, pg 154
|
|
|
indigofuzzy
Hazard to Others
Posts: 145
Registered: 1-10-2006
Location: DarkCity, Bay of Rainbows, Moon
Member Is Offline
Mood: Distilled
|
|
| Quote: | Originally posted by zoomer
- "White" LEDs are really just a blue, green, and red LED on the same die, so in a spectrograph it would have 3 narrow bands, instead of the nice
broadband output that you are looking for.
Z |
Actually, Most white LEDs are made with either a blue or near-UV led die and a coating of a yellow-glowing phosphor. This means there are actually two
peaks - one in the blue to near-uv, and a wider one in the yellow.
|
|
|
Quibbler
Hazard to Self
Posts: 65
Registered: 15-7-2005
Location: Trinidad and Tobago
Member Is Offline
Mood: Deflagrated
|
|
Well I've finally made a led spectrophotometer. I managed to get some fairly monochromatic leds with narrow beam angles. I have set up 5 at
490,520,574,612 and 644 nm. If they are slightly angled they can be directed onto one detector - a phototransistor (SFH309). I found LDRs to have too
slow a response. The voltage on the phototransistor is converted into a frequency using a LM358 as a VCO (I got the circuit from the National
Semiconductor data sheet) The pulses are fed into a computer through the parallel port and counted over 1/2 sec. The leds are swiched using the
parallel port also.
I have encountered two major problems led output varies with time hence the short measuring time (1/2 sec), and the dynamic range of the
phototransistor is so large that different resitors need to be switched in the VCO to cover any kind of absorbance range.
I am now in the process of trying to calibrate - this is turning out to be very difficult there is a lot of non-linearity here. I hope I can get a
simple polynomial fit between raw output and absorbance, but at the moment measuring lots of absorbance standards is proving to be a real pain.
|
|
|
Quibbler
Hazard to Self
Posts: 65
Registered: 15-7-2005
Location: Trinidad and Tobago
Member Is Offline
Mood: Deflagrated
|
|

I've taken a piture of it. In the middle is the sample holder (white circular thing) this is a piece of PVC pipe. The board on the left is the
detector board (the phototransistor has a piece of red tubing over it to limit reflected light). On the right is the LED switching board.
|
|
|
12AX7
Post Harlot
Posts: 4803
Registered: 8-3-2005
Location: oscillating
Member Is Offline
Mood: informative
|
|
Don't forget that silicon loves exponentials. You'll need a high order polynomial to equal that
It should be that light input is proportional to current flow through a photojunction, which is then exponential (Eber-Molls equ.) through the
transistor.
Tim
|
|
|
Twospoons
International Hazard
Posts: 1281
Registered: 26-7-2004
Location: Middle Earth
Member Is Offline
Mood: A trace of hope...
|
|
if the LED output varies with time, maybe they are being overdriven, heating up and thus changing output. Perhaps you should allow each led sufficient
on-time to stabilise thermally.
A photodiode (in reverse bias photocurrent mode) is a better choice for linearity - as 12AX7 points out :phototransistors have exponential response.
If you can, pick one for which there is a quantum efficiency curve in the datasheet - that will tell you relative sensitivity to different
wavelengths.
Your optical setup may benefit from a diffuser in front of the LEDs (frosted glass?), with a lightpipe of around 5-10cm length to even out the
illumination field (glass, acrylic or bright anodised Al tube), since you can't physically put the LEDs in the same place.
Helicopter: "helico" -> spiral, "pter" -> with wings
|
|
|
Polverone
Now celebrating 21 years of madness
Posts: 3186
Registered: 19-5-2002
Location: The Sunny Pacific Northwest
Member Is Offline
Mood: Waiting for spring
|
|
Old thread bump: Alexander Scheeline has made a guided inquiry project for students that revolves around building a spectrophotometer with cell phone hardware. It could be used as-is or taken as
a jumping off point for something more advanced.
PGP Key and corresponding e-mail address
|
|
|
franklyn
International Hazard
Posts: 3026
Registered: 30-5-2006
Location: Da Big Apple
Member Is Offline
Mood: No Mood
|
|
Do it yourself Spectrophotometer
How useful is it to have a spectrophotometer for identification and analysis of organic materials ?
I understand it has wider application in biochemistry than in organic chemistry. While I perused
analytic instruments on EBAY I found this item. Given the usual cost of such things it looks tempting.
http://cgi.ebay.com/ws/eBayISAPI.dll?ViewItem&item=31028...
http://www.cienytec.com/PDFS/Espec_SPEC20_OpMan_ing.pdf
I then searched the topic some and discovered that a computer utility exists which with simple gear
as can be seen below, will analyze a jpeg photo taken with a digital camera as would a dedicated
spectrophotometer instrument. Literally a do it yourself project. How cool is that !
- Ha ! Polverone beat me to it -
http://www.news.illinois.edu/WebsandThumbs/scheeline,alex/sp...

- The story -
http://www.wired.com/gadgetlab/tag/spectrophotometry
http://www.news.illinois.edu/news/10/1007scheeline_spectroph...
- How to -
http://www.asdlib.org/onlineArticles/elabware/Scheeline_Kell...
http://www.asdlib.org/onlineArticles/elabware/Scheeline_Kell...
- More
http://www.asdlib.org/onlineArticles/elabware/Scheeline_Kell...
- Download the stand alone program here -
http://www.asdlib.org/onlineArticles/elabware/Scheeline_Kell...
.
|
|
|
Ephoton
Hazard to Others
Posts: 463
Registered: 21-7-2005
Member Is Offline
Mood: trying to figure out why I need a dark room retreat when I live in a forest of wattle.
|
|
not sure if this has been posted here yet and sorry to bring up an old subject
but there was a guy in the Czech Technical University that made a nir spectrometer
that scans from 400nm too 900nm.
he placed his build cost at 25 euro and has handed up for evaluation a spectrometer
with usb connectivity and full plans that include all electronics theory and code to
run it.
I havent seen it untill tonight and I was looking into a stellarnet for over a thousand
dollars with simular capabilities.
It is far from perfect but a great start I think.
http://fzu.cz/~dominecf/electronics/usb-spect/usb_spectromet...
e3500 console login: root
bash-2.05#
|
|
|
mayko
International Hazard
Posts: 1218
Registered: 17-1-2013
Location: Carrboro, NC
Member Is Offline
Mood: anomalous (Euclid class)
|
|
Cool work everyone!
My first stab at DIY spectrophotometry was quite crude, consisting of a tube, a flashlight, and a transmission diffraction grating. This passed light
through the sample and projected the resulting spectrum onto the wall. A CdS sensor from an automatic nightlight was mounted on a graphing calculator
to slide back and forth through the spectrum, and measurements were taken by hand with a multimeter.

Next step: I mounted the device in a wooden box (used to contain clementine oranges). A flashlight beam was passed the sample and a slit, and the beam
was bounced off of a reflection transmission grating (a piece of a CD). Because the grating was on top of a servo motor, it could be rotated, which
would scan the spectrum across the sensor. All of this was controlled by an Arduino and a Python script.
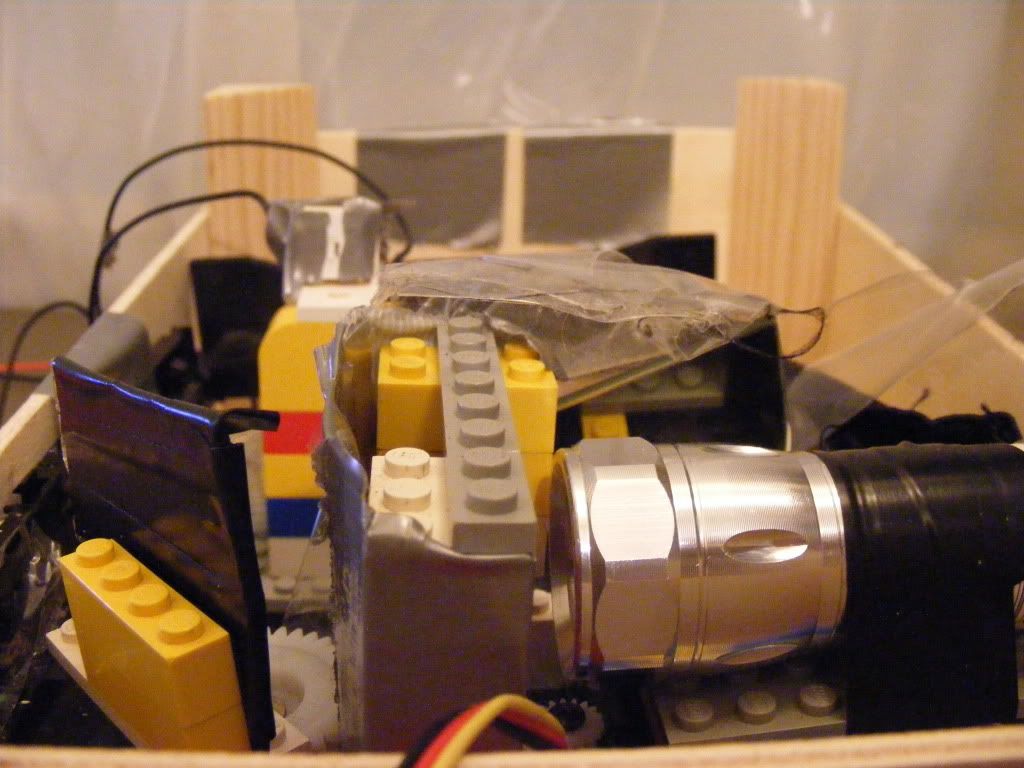
I've also put together an FAQ section and bibliography of other DIY Spectro projects. Next time I update, I'll add this discussion
Version I
Version II
FAQ/Biblio
|
|
|
White Yeti
National Hazard
Posts: 816
Registered: 20-7-2011
Location: Asperger's spectrum
Member Is Offline
Mood: delocalized
|
|
I don't know if this is helpful, but LED wavelength output is temperature dependent.
Bring out the liquid nitrogen!
http://www.youtube.com/watch?v=4w1HifFayNU
What you could do is measure the rate of change of wavelength with respect to time, assume that output intensity is fairly constant. Then you can
sweep the spectrum with just a few LEDs.
Even better, cool multiple LEDs simultaneously so that the frequency range of one LED ends where the frequency range of another LED begins.
How does that sound?
"Ja, Kalzium, das ist alles!" -Otto Loewi
|
|
|
nezza
Hazard to Others
Posts: 324
Registered: 17-4-2011
Location: UK
Member Is Offline
Mood: phosphorescent
|
|
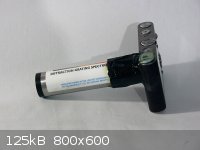
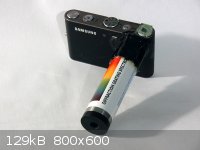
I too wanted to be able to visualise and measure spectra. This is how I went about it.
1. I bought a simple direct view spectroscope (From Patton Hawksley).
2. Araldite it to a compact camera making sure the spoectrum can be sphotographed
3. Work out where in the image the spectrum falls.
4. Use Paint shop pro to cut out the same part of the image each time.
5. Blur and tidy the image up a bit.
6. Import into BBC basic and run a program to measure the peaks.
The output was calibrated using lasers of known output frequency.
I have added a couple of pictures of the modified camera and the final output.
|
|
|
bfesser
Resident Wikipedian
Posts: 2114
Registered: 29-1-2008
Member Is Offline
Mood: No Mood
|
|
Wonderful! Thank you for sharing this. Now we'll have a use for any old digital cameras we have lying around, collecting dust. I had been waiting
for the <a href="http://store.publiclab.org/products/desktop-spectrometry-kit" target="_blank">Desktop Spectrometry Kit</a> <img
src="../scipics/_ext.png" /> from <a href="http://publiclab.org/" target="_blank">Public Lab</a> <img src="../scipics/_ext.png"
/> to become available. You may object that it's a little pricey at 40USD, but I think it's a pretty slick solution and hope to purchase one with
my next tax refund. They also have a <a href="http://store.publiclab.org/collections/spectrometry/products/foldable-mini-spectrometer"
target="_blank">Foldable Mini Spectrometer</a> <img src="../scipics/_ext.png" /> which works with smart phone cameras; 10USD for the
kit or <a href="http://publiclaboratory.org/wiki/foldable-spec#make-your-own" target="_blank">print/scrounge your own</a> <img
src="../scipics/_ext.png" />. Their <a href="http://www.kickstarter.com/projects/publiclab/infragram-the-infrared-photography-project?ref=card"
target-="_blank">Infrared (IR) Photography Project</a> <img src="../scipics/_ext.png" /> also looks promising ('237% funded' on
Kickstarter!).
<table><tr><td><img src="http://cdn.shopify.com/s/files/1/0198/8618/products/new-in-use_1024x1024.jpg?627" height="150"
/></td><td><img src="http://cdn.shopify.com/s/files/1/0198/8618/products/IMG_0096_1024x1024.jpg?627" height="150"
/></td><td><img src="https://s3.amazonaws.com/ksr/projects/543414/photo-main.jpg?1368160905" height="150"
/></td><td><img src="http://www.adafruit.com/images/medium/1367top_MED.jpg" height="150"
/></td></tr><tr><td>Desktop Spec. Kit</td><td>Foldable Spec. Kit</td><td>'IR Photography
Project'</td><td>RasPi Camera Module</td></table>
Finally, I'm very excited that the <a href="http://www.raspberrypi.org/archives/tag/camera-board" target="_blank">Camera Module</a>
<img src="../scipics/_ext.png" /> for the <a href="http://www.raspberrypi.org/faqs" target="_blank">Raspberry Pi</a> <img
src="../scipics/_ext.png" /> (RasPi) is finally available (from my favorite vendor, <a href="http://www.adafruit.com/category/105"
target="_blank">Adafruit</a> <img src="../scipics/_ext.png" />! I
look forward to using these for astrophotography, IR photography, microscopy, and possibly building a RasPi based spectrophotometer with my damaged
Chinese Model B rev 2—the UK board is safe. I hope that someday we'll all have near-IR–Vis spectrometers in our home labs or even
in our pockets.
TL;DR: <a href="http://publiclaboratory.org/wiki/foldable-spec#make-your-own" target="_blank">Click here!</a> <img
src="../scipics/_ext.png" />
|
|
|
phlogiston
International Hazard
Posts: 1375
Registered: 26-4-2008
Location: Neon Thorium Erbium Lanthanum Neodymium Sulphur
Member Is Offline
Mood: pyrophoric
|
|
nezza, do you know the output signal vs. light intensity at different wavelengths for you camera? In other words: (how) do you calibrate the intensity
scale?
-----
"If a rocket goes up, who cares where it comes down, that's not my concern said Wernher von Braun" - Tom Lehrer |
|
|
AndersHoveland
Hazard to Other Members, due to repeated speculation and posting of untested highly dangerous procedures!
Posts: 1986
Registered: 2-3-2011
Member Is Offline
Mood: No Mood
|
|
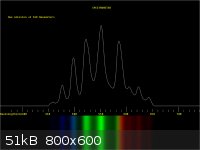
I have several LED light bulbs. While the light is yellowish "white", I do not care for the light they give off. They do not have the same spectrum as
incandescent, and it looks a little strange, difficult to describe. The white LED light is like a fluorescent yellowish tinted with purplish blue, and
a little pinkish colored at the same time.
When I looked at the white LED light through a prism, the deep red was not as brilliant, it was more orangish, and the band where there should have
been a green-blue and light blue color was very dim.
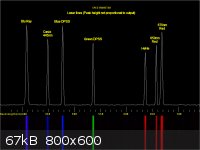
The light from a typical fluorescent lamp has just 3 bright lines, red, green, and blue. There are also a few violet lines, and blurry very dim bands
in the yellow and lighter blue, if one looks closely. Definitely not a full spectrum light source.
I have also looked at the spectrum of metal halide street lamps with a CD grating. Many distinct bands of colors. The strange thing that do not
understand is there is a bright thick yellow-orangish band that fades outward, but in the center of this band is a clear distinct dark line. Is this
the sodium line? Is there some sort of forbidden quantum state between those two lines?
[Edited on 10-7-2013 by AndersHoveland]
|
|
|
| Pages:
1
2
3 |


