Quibbler
Hazard to Self

Posts: 65
Registered: 15-7-2005
Location: Trinidad and Tobago
Member Is Offline
Mood: Deflagrated
|
|
Homemade spectrometer
Many years ago I was involved in a thread here to measure the absorbance of visible light for a Beer-Lambert type concentration determinations.
I had some success using LEDs (with tight wavelenghts).
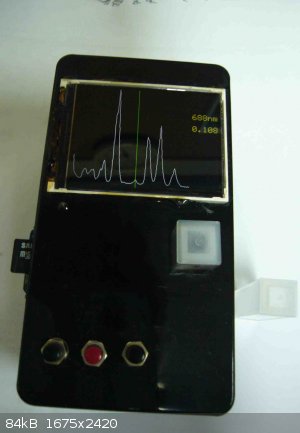
Now I have made a spectrophotometer that will go form 400 to 900 nm and has a resolution of about 4 nm.
I have attached a picture it shows a test spectrum of a didymium filter (used for wavelength calibration). If you would like to check the spectrum
here is a link to the expected spectrum.
didymium glass reference
For scale you can see a 1 cm cuvette on the right below the screen and sticking out of the left sde is a micro SD card (should I need to store the
spectrum).
[Edited on 3-8-2016 by Quibbler]
|
|
|
Marvin
National Hazard
Posts: 995
Registered: 13-10-2002
Member Is Offline
Mood: No Mood
|
|
That looks impressive. Can you post build details?
|
|
|
Quibbler
Hazard to Self
Posts: 65
Registered: 15-7-2005
Location: Trinidad and Tobago
Member Is Offline
Mood: Deflagrated
|
|
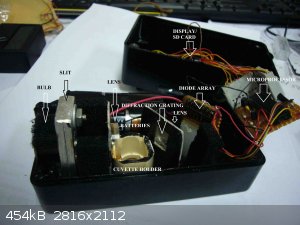
Attached is a photo with the top removed showing the works.
The main items are:
Xenon torch bulb
Diode array (1x256) TSL1402 (from Digikey)
PIC16F1789 microprocessor (large RAM needed)
The diffraction grating is one of those plastic holographic ones (1000 lines) which are cheap.
The lenses (two) are plastic 3cm focal length.
The display is colour TFT 320x240 which are very cheap (see S.K.Pang for example) some have an integral SD socket (mine didn't).
Actually a B/W display would have been better, but you can't get them (the colour display is slow and sucks power).
|
|
|
Marvin
National Hazard
Posts: 995
Registered: 13-10-2002
Member Is Offline
Mood: No Mood
|
|
That's a really cool build and kudos for using veroboard. That's a proper old school prototyping/one off method. What's the resolution of your ADC?
have you tried doing Beer Lambert stuff?
|
|
|
Quibbler
Hazard to Self
Posts: 65
Registered: 15-7-2005
Location: Trinidad and Tobago
Member Is Offline
Mood: Deflagrated
|
|
The 16F1789 has a 12-bit ADC. As the collection is very fast I normally collect 256 scans then throw away the least significant 4 bits and store the
reading as a 16-bit number. This is converted into absorbance using a lookup table.
One of the problems of using a diode array is stray scattering from the diffraction grating can cause problems. There is a routine that tries to
compensate for this, but it doesn't always achieve perfection.
The B-L plots are good up to Abs of 1.5 then a longer intergration time is needed on the diode array.
Attached is the spectrum of a real sample potassium permanganate. This is one of the few compounds that have a marginally interesting visible
spectrum.

[Edited on 4-8-2016 by Quibbler]
|
|
|
Texium
|
Thread Moved
27-11-2023 at 10:45 |