| Pages:
1
2
3
4 |
byko3y
National Hazard

Posts: 721
Registered: 16-3-2015
Member Is Offline
Mood: dooM
|
|
Invention of CO2 as a cause of temperature change is not scientifical, but bureaucratical.
Facts show that:
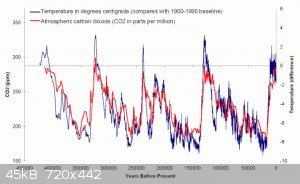
- temperature raise causes raise in the CO2 level after thousand of years:
http://www.geocraft.com/WVFossils/last_400k_yrs.html
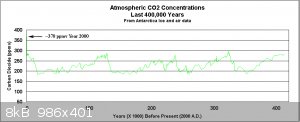
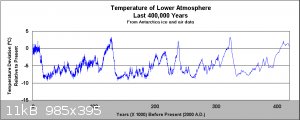
(notice X-axis going in reversed time)
https://wattsupwiththat.com/2012/04/11/does-co2-correlate-wi...
"overall observations are consistent with temperature rise causing the oceans to release part of their dissolved CO2 after substantial lag time, yet
not consistent with CO2 being the primary driver of climate."
- concentrations of carbon dioxide and methane are insignificant compared to the main earth greenhouse gas - water (H2O).
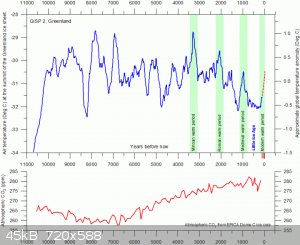
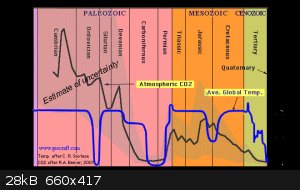
Official conclusion was made by cherry picking from available data, mostly based on medium-scale correlation, because large scale graph shows no
correlation
https://medium.com/@ghornerhb/heres-a-better-graph-of-co2-an...
and the thousand years lag of CO2 level is barely visible on medium scale:
[Edited on 6-4-2018 by byko3y]
|
|
|
JJay
International Hazard
Posts: 3440
Registered: 15-10-2015
Member Is Offline
|
|
Hah. As we all know, fires produce carbon dioxide. Try building a fire next to a thermometer and see what happens. Clearly, only a fool would try to
deny science.
|
|
|
byko3y
National Hazard
Posts: 721
Registered: 16-3-2015
Member Is Offline
Mood: dooM
|
|
JJay, aren't we talking about global warming? Was your message a joke?
|
|
|
JJay
International Hazard
Posts: 3440
Registered: 15-10-2015
Member Is Offline
|
|
Yes, it was a joke.
|
|
|
AJKOER
Radically Dubious
Posts: 3026
Registered: 7-5-2011
Member Is Offline
Mood: No Mood
|
|
Quote: Originally posted by mayko  | ]
........
| Quote: | So the impact of CH4 due to its reduce rate of conversion to CO2 with time is effectively increasing from hydroxyl radical loss. I make sense of the
latter as more CO2 (from all sources inclusive of methane) plus water vapor means increase HCO3- ions which are scavengers of hydroxyl radicals via:
HCO3- + .OH --> H2O + .CO3-
creating a less powerful (than the hydroxyl radical) carbonate radical anion. So, my opinion is that the above reaction could be increasingly in
competition with the action of .OH on CH4 as CO2 levels rise. In other words, a compounding effect which is apparently not baked into the current
widely promulgated science.
|
Is there any evidence that this reaction takes place at all under atmospheric conditions?
......
|
Yes, here is an article discussing the decomposition of .CO3- and its hydrate at sunrise, namely: .CO3- H2O, "Sunlight photodestruction of CO3−,
CO3−·H2O, and O3−: The importance of photodissociation to the D region electron densities at sunrise" by James R. Peterson.
Link: https://agupubs.onlinelibrary.wiley.com/doi/abs/10.1029/JA08...
More background on the carbonate radical formation, see "Rate constant for reaction of hydroxyl radicals with bicarbonate ions☆" , at https://www.sciencedirect.com/science/article/pii/1359019786... . To quote from the abstract:
"The rate constant for reaction of hydroxyl radicals with the bicarbonate ion has been determined to be 8.5 × 10^6 dm3 mol-1s-1. This value was
calculated from: the measured rate of formation of the CO-3 radical in pulsed electron irradiation of bicarbonate solutions over the pH range
7.0–9.4; the pK for the equilibrium HCO3- ⇌ CO3= + H+; and the rate constant for hydroxyl radicals reacting with the carbonate ion."
--------------------------------------
The decomposition product by sunlight on .CO3- yielding CO2 + .O-, may result upon contact with O2, some .O3- via:
.CO3- + hv --> CO2 + .O-
.O- + O2 = .O3-
where the ozonide radical may attack CH4, but the following reaction is also possible, consuming more hydroxyl radical but liberating ozone:
.O3- + .OH --> O3 + OH-
However, the carbonate radical release of CO2 with added H2O could remove more .OH via the bicarbonate path, where we started:
CO2 + H2O ⇌ H+ + HCO3-
HCO3- + .OH --> H2O + .CO3-
The net of all of the above is:
O2 + 2 .OH + hv --H2O, .CO3-, CO2 ---> O3 + H2O
which would appear to favor some possible ozone formation at the expense of two hydroxyl radicals needed for methane removal.
So, speculatively, the ozone hole gets better, but we all bake  . .
[Edited on 6-4-2018 by AJKOER]
|
|
|
mayko
International Hazard
Posts: 1218
Registered: 17-1-2013
Location: Carrboro, NC
Member Is Offline
Mood: anomalous (Euclid class)
|
|
The "lag-lead" phenomenon is a real effect, but you're overstating its generality and importance to present-day observations. The plots you've shown
to illustrate it are all of CO2/temperature variations, over the last several Quaternary glaciation cycles, as reconstructed from individual ice
cores. This tells us something about how Quaternary ice ages unfold, but it doesn't establish, as a generalized law, that a CO2 change will never
precede or cause a temperature change, and there are good physical reasons for thinking that it could.
WUWT is, uh, less than reputable as far as sources go 
But the quote you've pulled out is correct, to the extent that it refers to Quaternary glacial cycles. The generally accepted explanation of their
driver is orbital forcing, in which small wobbles in the Earth's orbit slowly change the incoming solar energy. This small change is amplified by the
outgassing feedback that you mention. There are a number of reasons that we know this isn't what's happening right now; one of them is that the ocean
is currently a net carbon sink, not a net carbon source.
Another aspect discussed in the Shakun paper from the WUWT link is that the lag/lead effect differs between hemispheres. Oxygen isotope proxies from
ice cores are "good enough" for many purposes, but they are regionally biased, and using Antarctic ice cores exaggerates the lag-lead in one
direction, while ignoring that Northern hemisphere proxies tend to show CO2 leading and temperature lagging!
There is much more to the issue. If you haven't read the Shakun paper, I highly recommend it.
Attachment: Global warming preceded by increasing carbon dioxide concentrations during the last degalciation - Shakun et al 2012.pdf (905kB)
This file has been downloaded 239 times
| Quote: |
- concentrations of carbon dioxide and methane are insignificant compared to the main earth greenhouse gas - water (H2O).
|
Concentration isn't the same as impact. A few back of the envelope calculations give me a ratio of maybe 50:1, water vapor to CO2, but the radiative forcing of water vapor is only about three times that of CO2. Even that is a little misleading, because the water vapor present in
the air is caused by temperature (Clausius-Clapeyron), and the CO2 concentration isn't, at least in the present. As I mentioned earlier in the thread,
water vapor acts mostly as a feedback; that is to say, non-condensing greenhouse gas forcing is much of the reason that there's water vapor in the
first place.
| Quote: |
Official conclusion was made by cherry picking from available data,
|
Anthropogenic global warming due to increased greenhouse effect was predicted in the late 19th century on the basis of uncontroversial thermodynamics
and radiation physics, long before there was any data to cherrypick.
That large scale graph also doesn't account for many other confounding factors that change over geologic time, but aren't responsible for current
observations. Examples include changes in solar intensity or continental arrangement.
As long as we're talking about correlations, I want to back up a bit.
Now, JJay has said a great many interesting things here, which are "huge, if true". I want to roll back to the start, leaving aside issues like his
inability thusfar to relate his informal statistical musings to his mechanistic hypothesis of UHI as a temperature driver. If you'll recall, his
original complaint regarding the temperature record was that its variance was not constant, and in particular, that the variance was correlated with
the anomaly. I've dwelt enough for now on the often eye-bugging notion that this is a worse problem for anomalies than for raw temperatures, so I'm
going to move to a different question, something I've taken at face value so far: is it even true??
Last I heard, JJay hadn't gotten around to formally testing his observation. Maybe it would be true of the data in the graph he presented, but part
of my concern is the plotted data itself. Remember, he doesn't seem to be using the GISS global temperature time series. He's using a hand-rolled
global time series which he constructed from "the data from that video". It's actually not obvious what his starting data even was, since it appears
that several vaguely identified datasets were used in the visualization he linked to. (The most explicitly named is ERSSTv4, which is sea surface
temperature data.) Now, at first I thought he was averaging a bunch of already-gridded data, which is weird when there's already a global time series
available, but I didn't think he'd go too wrong. But maybe that isn't what he did, or maybe it did go wrong somehow.
(Looking back, I suspect a lot of his questions and objections are less about the practice of standardizing a station record to its reference
climatology, and more about issues like "How does one combine local station records with an uneven spatial & temporal distribution into a regional
or global record?", "How does one compare (mostly) fixed land stations to (mostly) transient ocean measurements?" and "How does one account for
non-climatic artifacts?" These are questions very much worth asking, but they're less about what an anomaly time series is, than about what you do
with one once you've got it. If he wants a soundbite answer, he's out of luck - homogenization and gridding are broad, deep, complex topics.
Ordinarily, I'd suggest doing some background reading, perhaps starting with the FAQ section for the GISS data. However, even when the topic is complicated enough to be Nobel-worthy, JJay seems averse,
even hostile to getting oriented ahead of time.)
I don't have the data JJay plotted handy, and I'd be disinclined to recreate it even if I thought I had sufficient information to do so. Instead, I'm
using an actual global time series published by GISS (specifically, the global LOTI, here ). If it shows the behavior JJay claims, we'll know that behavior is at least somewhat robust. If it doesn't, there's a discrepancy
somewhere. Maybe he isn't using the dataset he thinks he is. Maybe he dorked up the averaging process. Maybe renormalizing by month isn't a good
decision. Maybe statistics-by-eyeball isn't reliable. It would be possible that it's GISS who are wrong, but without more information I find that
unlikely, not because I think NASA is an unassailable, inerrant authority, but because they aren't the ones who just spent a half dozen posts telling
me that two time series differing by a constant have different correlation properties.
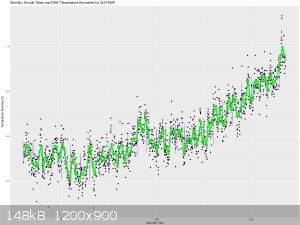
Here's the monthly anomalies, plotted in black, and the annual in green. The data have been binned into non-overlapping 5 year windows, marked by
purple lines. Line height is used to indicate the mean anomaly over this window; this is a quick and dirty estimate of both A(t) and F(t) (since the
long-term mean of V(t) is zero). The vertical tick height on the window boundaries is root mean square error, though I don't think it's especially
helpful here.
(A quick aside is necessary; I think I actually misstated the terms of JJay's argument earlier, when I said things like "(...) it is inefficient in
this case to estimate V(t) from A(t) because V(t) is correlated with T(t). " Instead, I'm pretty sure it would have to be a time-dependent variance
measure of A(t), rather than the unforced variation itself, which we were correlating with T(t). For example, we might be interested in the
instantaneous standard deviation of A(t), as a function of time. Call it S(A,t). I tried to correct myself the last time I brought it up, but it
deserves to have attention drawn to it, because I'm about to calculate some variance measures as functions of time. As embarrassing a flub as this is,
it's worse for JJay, since he appeared to agree with the accidentally bogus statement without noticing, and because it doesn't change the trivial fact
that A(t) and T(t) have the same correlation properties with *arbitrary* datasets.)
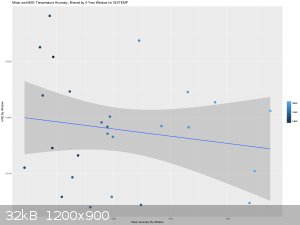
JJay has suggested that a number of variation measures are correlated with the anomalies, including variance and mean square error. These were
calculated over the windows, using the window mean as an estimator, and correlations were tested via least squares linear regression. The results for
mean square error are typical:
| Code: |
Call:
lm(formula = GISTEMP_global.windowed$mse ~ GISTEMP_global.windowed$mean)

Residuals:
       Min         1Q     Median         3Q        Max
-0.0099664 -0.0038843  0.0001331  0.0034176  0.0138152

Coefficients:
                              Estimate Std. Error t value Pr(>|t|)
(Intercept)                   0.018928   0.001039  18.221 6.01e-16 ***
GISTEMP_global.windowed$mean -0.005960   0.003538  -1.685    0.104
---
Signif. codes:  0 ‘***’ 0.001 ‘**’ 0.01 ‘*’ 0.05 ‘.’ 0.1 ‘ ’ 1

Residual standard error: 0.005396 on 25 degrees of freedom
Multiple R-squared:  0.102,	Adjusted R-squared:  0.06604
F-statistic: 2.838 on 1 and 25 DF,  p-value: 0.1045
|
I've tried different window sizes, different window starts, non-overlapping and rolling. I've tested mean square error and variance (these are
essentially identical here, though they need not be), root mean square error and standard deviation (ditto), and time. In spite of a great deal of
uncorrected p-hacking in favor of JJay's hypothesis, I can't seem to crack the 95% confidence interval, and the 90% only once in dozens of tests. That
doesn't mean it isn't a real, but it's not significant by this test. It's possible that my methods aren't sufficient or appropriate to detect the
correlation, but then again, JJay hasn't even outlined what methods would be, to say nothing of implementing them. When I use data that isn't sketchy
homebrew, I completely fail to replicate the statistics-by-eyeball result that was the main motivating observation behind much of this discussion.
al-khemie is not a terrorist organization
"Chemicals, chemicals... I need chemicals!" - George Hayduke
"Wubbalubba dub-dub!" - Rick Sanchez
|
|
|
mayko
International Hazard
Posts: 1218
Registered: 17-1-2013
Location: Carrboro, NC
Member Is Offline
Mood: anomalous (Euclid class)
|
|
| Quote: Originally posted by AJKOER |
Yes, here is an article discussing the decomposition of .CO3- and its hydrate at sunrise, namely: .CO3- H2O, "Sunlight photodestruction of CO3−,
CO3−·H2O, and O3−: The importance of photodissociation to the D region electron densities at sunrise" by James R. Peterson.
Link: https://agupubs.onlinelibrary.wiley.com/doi/abs/10.1029/JA08...
More background on the carbonate radical formation, see "Rate constant for reaction of hydroxyl radicals with bicarbonate ions☆" , at https://www.sciencedirect.com/science/article/pii/1359019786... . To quote from the abstract:
"The rate constant for reaction of hydroxyl radicals with the bicarbonate ion has been determined to be 8.5 × 10^6 dm3 mol-1s-1. This value was
calculated from: the measured rate of formation of the CO-3 radical in pulsed electron irradiation of bicarbonate solutions over the pH range
7.0–9.4; the pK for the equilibrium HCO3- ⇌ CO3= + H+; and the rate constant for hydroxyl radicals reacting with the carbonate ion."
|
That's pretty interesting; I'm still skeptical it would be a major player but then again I didn't think the reaction would go at all!
al-khemie is not a terrorist organization
"Chemicals, chemicals... I need chemicals!" - George Hayduke
"Wubbalubba dub-dub!" - Rick Sanchez
|
|
|
AJKOER
Radically Dubious
Posts: 3026
Registered: 7-5-2011
Member Is Offline
Mood: No Mood
|
|
One idea of what to do with the raw time series data augmented by actual collection data.
Start by constructing a regression model where the all the raw temperature data collected at time t is subject to a transform (like log), which is
then regressed against dummy variables (0 or 1) for variables like hemisphere, a land reading, a water location, month (that is, 12 seasonal
dummies)..., and non-dummy variables of known estimates of active greenhouse presence minus its mean and the sun irradiance at that time (also minus
its mean). This results in a standardized data value for time t and an estimate of its statistical variance for the transformed data point t (and an
implied value for the untransformed data point).
In other words, remove poor simple models to correct for seasonal effects and the like, and do incorporate data variance estimates (via generalized
least-squares), in deriving standardizing factors.
Use the above standardized data and error estimates in a generalized least-square (with likely an auto-correlation correction) trend model (or time
series analysis) which incorporates variance estimates of the standardized data.
If such a model shows a time trend, it may be due to unknown estimates of green house gases like CH4,..., or other missing variable(s).
---------------------------------------------------------
If the data series is long enough (more than 2x60 at least), cut the data in half and estimate the standardizing model on every other even data point.
Then, test the model on the excluded odd points.
Repeat the exercise building the model on the odd points and test on the even points. Why suffer this loss of data? Because now the model
specification, based on a close examination of half the data, is a bit more separated (except for strong serial correlation, in which case, use ever
other 3rd point, resulting in 3 models) for testing predictive ability.
Note both predictive ability (actual vs. forecast) and deviation in regression coefficients between the two data sets. The range (high - low) of the
individual coefficients is also a variability estimate and can also be roughly converted into an estimate of the regression coefficient standard
deviation.
[Edited on 13-4-2018 by AJKOER]
|
|
|
byko3y
National Hazard
Posts: 721
Registered: 16-3-2015
Member Is Offline
Mood: dooM
|
|
AJKOER, you can actually find different sources of data providing slightly different result, all the methods are publically known https://www.skepticalscience.com/surface-temperature-measure...
But the overall trend of temperature abnormality is similar and insignificant to humanity.
|
|
|
byko3y
National Hazard
Posts: 721
Registered: 16-3-2015
Member Is Offline
Mood: dooM
|
|
| Quote: Originally posted by mayko | There is much more to the issue. If you haven't read the Shakun paper, I highly recommend it.
Attachment: Global warming preceded by increasing carbon dioxide concentrations during the last degalciation - Shakun et al 2012.pdf (905kB)
|
Shakun's article in "Nature", being a mainstream media, emphasizes the importance of one period with good CO2 lag-correlation, while forgetting about
everything else.
| Quote: | | A few back of the envelope calculations give me a ratio of maybe 50:1, water vapor to CO2, but the radiative forcing of water vapor is only about
three times that of CO2. |
CO2 might absorb more IR radiation at same concentration, yet the warter still provides the most impact in terms of absorption of thermal radiation:
(table from http://coelho.mota.googlepages.com/RadiationBudget.pdf )
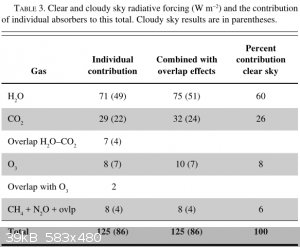
Average concentration of CO2 is 400 ppm, average concentration of water is 5000 ppm ( http://cdiac.ess-dive.lbl.gov/pns/current_ghg.html )
I can approximate ratio of specific absorption CO2:H2O as 5:1 (based on ppm concentration values (71:5000)/(29:400) ). Probably you just put excessive
zero in your number. And probably you are trying to bullshit us.
| Quote: | | Anthropogenic global warming due to increased greenhouse effect was predicted in the late 19th century on the basis of uncontroversial thermodynamics
and radiation physics, long before there was any data to cherrypick. |
A lot of crazy shit was predicted
century ago, luckily most of it was rejected. That's why it's important to stick to the facts and overall picture, and not to the random statements.
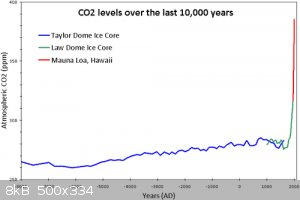
I'm talking not only about cherrypicking in long and medium range, but also in short range, once again the picture:
shows no correlation, but if you pick the last 100 years only, you might find the correlation out of nothing. You can also pick another 100 years from
the graph and find correlation there too, although it does not exists on the larger picture.
|
|
|
mayko
International Hazard
Posts: 1218
Registered: 17-1-2013
Location: Carrboro, NC
Member Is Offline
Mood: anomalous (Euclid class)
|
|
| Quote: Originally posted by AJKOER | One idea of what to do with the raw time series data augmented by actual collection data.
Start by constructing a regression model where the all the raw temperature data collected at time t is subject to a transform (like log), which is
then regressed against dummy variables (0 or 1) for variables like hemisphere, a land reading, a water location, month (that is, 12 seasonal
dummies)..., and non-dummy variables of known estimates of active greenhouse presence minus its mean and the sun irradiance at that time (also minus
its mean). This results in a standardized data value for time t and an estimate of its statistical variance for the transformed data point t (and an
implied value for the untransformed data point).
In other words, remove poor simple models to correct for seasonal effects and the like, and do incorporate data variance estimates (via generalized
least-squares), in deriving standardizing factors.
Use the above standardized data and error estimates in a generalized least-square (with likely an auto-correlation correction) trend model (or time
series analysis) which incorporates variance estimates of the standardized data.
|
Sure, you could do that sort of thing. The specifics of the regression and interpretation will likely depend heavily on what particular questions are
being asked of the data: are we trying to tease out the influence of methane? are we looking for an artefactual urbanization signal? One thing you
mention is "predictive ability (actual vs. forecast)", which suggests that you're planning to extrapolate your fitted curve into the future. This may
or may not be appropriate, and it's not how simulation-based "climate models", such as GCMs, work. They're more like physically-informed differential
equation solvers than data regressors.
If you're just interested in excluding urbanization as a major explanation of observed warming, there are probably easier ways to do it, such as
comparing rural station trends to urban station trends, comparing land station trends to sea trends, or using sea level as a global proxy thermometer.
(Funny story, Ross McKitrick once did a curve-fitting exercise of the sort you describe, and found that economic activity is correlated with warming
intensity, perhaps suggesting an urbanization component or other artefacts. Unfortunately for him, his result was due to a number of bungles,
including forgetting to convert between degrees and radians (!)
http://web.archive.org/web/20090425085804/http://scienceblog... )
One last loose end to tie up on the topic of regressions: what with heteroskedasticity being the econometrics buzzword of the month, I'm surprised no
one has pointed out that my MSE vs mean regression has a mild case of it. However, using robust standard error is not sufficient to rescue the significance. As long as we're trying to poke holes in the regression, we might also
check for outliers and see if removing them leaves the results intact, or if they are introducing an unrepresentative bias. By
[url=https://en.wikipedia.org/wiki/Outlier#Tukey's_fences]Tukey's method[/url], there is a single mild outlier near 1900. Removing this slashes the
modeled effect size by a third and obliterates whatever marginal significance it had.
Every single data set presented there is in temperature anomalies. Clearly, you and JJay need to sit down and get your heads together!
| Quote: | | Shakun's article in "Nature", being a mainstream media, emphasizes the importance of one period with good CO2 lag-correlation, while forgetting about
everything else. |
The purpose of the article was to investigate Quaternary declaciations. I'm not sure how one would go about this, other than to study high-quality
data from the Quaternary. It is certainly not the case that they have 'forgotten' the other 4.5 billion years of geologic time!
| Quote: |
| Quote: | | A few back of the envelope calculations give me a ratio of maybe 50:1, water vapor to CO2, but the radiative forcing of water vapor is only about
three times that of CO2. |
CO2 might absorb more IR radiation at same concentration, yet the warter still provides the most impact in terms of absorption of thermal radiation:
(table from http://coelho.mota.googlepages.com/RadiationBudget.pdf ) |
That table is from the article I linked to. It supports my quoted figure of "about three times that of CO2", which is actually generous. Those numbers
are not radiative forcing at equal concentration; they're radiative forcing in real-world conditions.
Furthermore, maybe I'm misunderstanding you, but how is Bulletin of the American Meteorological Society anything but 'a mainstream media'? Why is that
a problem for Nature, but not BAMS ?
| Quote: | Average concentration of CO2 is 400 ppm, average concentration of water is 5000 ppm ( http://cdiac.ess-dive.lbl.gov/pns/current_ghg.html )
I can approximate ratio of specific absorption CO2:H2O as 5:1 (based on ppm concentration values (71:5000)/(29:400) ). Probably you just put excessive
zero in your number. And probably you are trying to bullshit us. |
"Probably", part of the difference is that I used a different source for water vapor concentration:
https://en.wikipedia.org/wiki/Water_vapor#In_Earth's_atmosphere
But accepting your figures, when I divide 5000 by 400, I get 12.5 . This still illustrates the central point: in spite of a 12-fold difference in
concentration, water vapor only exerts a three-fold bigger radiative forcing.
Your calculation of 'specific absorption' seems to be premised on the misconception that the stated radiative forcings are given at equal
concentration, which they aren't. Look at the units: they're Watts per meter squared, not Watts per meter squared per ppm. Or, look at the 'percent
contribution to clear sky' column.
Anyway, thanks for the assumption of good faith 
| Quote: | | Quote: | | Anthropogenic global warming due to increased greenhouse effect was predicted in the late 19th century on the basis of uncontroversial thermodynamics
and radiation physics, long before there was any data to cherrypick. |
A lot of crazy shit was predicted century ago, luckily most of it was rejected. That's why it's important to stick to the facts and overall picture,
and not to the random statements. |
Do you reject much of acid-base chemistry and chemical kinetics on the same principle? They were set down by the same person, after all!
| Quote: | I'm talking not only about cherrypicking in long and medium range, but also in short range, once again the picture:
shows no correlation, but if you pick the last 100 years only, you might find the correlation out of nothing. You can also pick another 100 years from
the graph and find correlation there too, although it does not exists on the larger picture. |
This graph also does not include the long-term change in insolation due to orbital forcing, which generally drives temperature changes at that time
scale, so there's a confounding factor that isn't visually being taken into account. The graph is of the Holocene, the time period since the last
deglaciation; this period has been remarkably stable and long-lasting in the context of the Quaternary. This stability in the face of orbital forcing
needs to be considered, as long as we're doing informal visual correlating.
Dig further, using one of your own sources, and you find a great deal of other shenanigans lurking in this particular graph:
https://skepticalscience.com/crux-of-a-core3.html
Also, it uses temperature anomalies. Dang!
al-khemie is not a terrorist organization
"Chemicals, chemicals... I need chemicals!" - George Hayduke
"Wubbalubba dub-dub!" - Rick Sanchez
|
|
|
byko3y
National Hazard
Posts: 721
Registered: 16-3-2015
Member Is Offline
Mood: dooM
|
|
| Quote: Originally posted by mayko |
(Funny story, Ross McKitrick once did a curve-fitting exercise of the sort you describe, and found that economic activity is correlated with warming
intensity, perhaps suggesting an urbanization component or other artefacts. Unfortunately for him, his result was due to a number of bungles,
including forgetting to convert between degrees and radians (!) |
Funny story, there are researchers that found urbanization artifact to be a valid cause of the measured temperature deviation : https://www.hindawi.com/journals/amete/2014/374987/
They use no prediction, no models, just pure measured data. Even the critics of the theory have to accept some of the data, because the effect was
well know long ago, we just don't know the extend of its actual impact: https://skepticalscience.com/urban-heat-island-effect-interm...
Strange thing: the data from satellites and weather ballons does not show such steep rise of temperature as might be expected from greenhouse effect:
https://www.americanexperiment.org/2016/11/climate-change-2-...
Mainstream politics had to reshuffle the satellite data many years after the measurements were made, in order to make them match the surface data: https://skepticalscience.com/satellite-measurements-warming-...
| Quote: | | Furthermore, maybe I'm misunderstanding you, but how is Bulletin of the American Meteorological Society anything but 'a mainstream media'? Why is that
a problem for Nature, but not BAMS ? |
I'm not talking they are evil, I'm just trying to say you cannot
publish any independant research in the mainstream media. If you are looking for truth, then you need to have additional sources of information.
| Quote: | "Probably", part of the difference is that I used a different source for water vapor concentration:
https://en.wikipedia.org/wiki/Water_vapor#In_Earth's_atmosphere
But accepting your figures, when I divide 5000 by 400, I get 12.5 . This still illustrates the central point: in spite of a 12-fold difference in
concentration, water vapor only exerts a three-fold bigger radiative forcing.
Your calculation of 'specific absorption' seems to be premised on the misconception that the stated radiative forcings are given at equal
concentration, which they aren't. Look at the units: they're Watts per meter squared, not Watts per meter squared per ppm. Or, look at the 'percent
contribution to clear sky' column. |
12.5/4 = 4.17, which is very close to my number. Of couse the
concentration might fluctuate, water might change its state, but I talk about average approximation.
| Quote: | | Do you reject much of acid-base chemistry and chemical kinetics on the same principle? They were set down by the same person, after all!
|
I don't believe in authority and fame. Even greatest scientists made mistakes. I believe in facts.
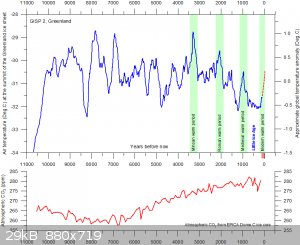
Okay, you got me, indeed, the temperature on that
graph is a local Greenland temperature. Let's look at global graphs then:
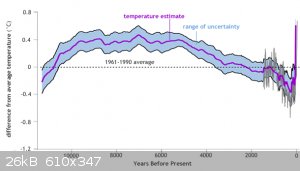
( data from http://dx.doi.org/10.1126/science.1228026 )
Are you happy with this correlation now?
|
|
|
mayko
International Hazard
Posts: 1218
Registered: 17-1-2013
Location: Carrboro, NC
Member Is Offline
Mood: anomalous (Euclid class)
|
|
It's certainly true that urbanization and land use change in general can have an impact on regional trends, such as in the study you've linked to.
That doesn't make it a major driver of global trends, though. The study does an experiment which I suggested, which is to compare urban and rural
stations, and they find warming at both, which would suggest that urbanization isn't the only driver, even at the regional scale.
That link does not support your argument. In fact, it provides another example the the urban-rural station comparison I mentioned. (Don't let JJay
know that all their data are anomalies!)
Here's Gavin Schmidt explaining why the figure presented here is misleading, and putting it in context:
http://www.realclimate.org/index.php/archives/2016/05/compar...
I don't know how you came to a conclusion about attribution from that article.
That link does not support your description. It gives a pretty standard account of the time the UAH team insisted their data were right and everyone
else's were wrong, were shown to be incorrect, and had to account for orbital decay of their satellites with a correction so large that it changed
the sign of the long-term trend. This was not a case where "Mainstream politics had to reshuffle the satellite data"; it was one of the "random
statements" which ultimately "was rejected". I thought you were in favor of that?
| Quote: |
| Quote: | "Probably", part of the difference is that I used a different source for water vapor concentration:
https://en.wikipedia.org/wiki/Water_vapor#In_Earth's_atmosphere
But accepting your figures, when I divide 5000 by 400, I get 12.5 . This still illustrates the central point: in spite of a 12-fold difference in
concentration, water vapor only exerts a three-fold bigger radiative forcing.
Your calculation of 'specific absorption' seems to be premised on the misconception that the stated radiative forcings are given at equal
concentration, which they aren't. Look at the units: they're Watts per meter squared, not Watts per meter squared per ppm. Or, look at the 'percent
contribution to clear sky' column. |
12.5/4 = 4.17, which is very close to my number. Of couse the
concentration might fluctuate, water might change its state, but I talk about average approximation.
|
12.5 is the ratio of water vapor concentration to CO2 concentration. Why are you dividing 12.5 by 4? What is the physical meaning of a quarter of the
ratio of concentrations? Why is dividing by 4 necessary to compare the relative concentrations to their relative radiative forcings? "Your number" was
a combination of the radiative forcings of CO2 and H2O, weighted by meaningless coefficients. Why are we comparing anything to it?
Also, 12.5/4 = 3.125, not 4.17
| Quote: | | Quote: | | Do you reject much of acid-base chemistry and chemical kinetics on the same principle? They were set down by the same person, after all!
|
I don't believe in authority and fame. Even greatest scientists made mistakes. I believe in facts.
|
Cool, I like facts too! It *is* a fact that "Anthropogenic global warming due to increased greenhouse effect was predicted in the late 19th century"
on a physical science basis. That physical science basis contains many facts about thermodynamics and radiation.
That this happened "long before there was any data to cherrypick" is one way we know that it *is not* a fact that "Official conclusion was made by
cherry picking from available data"
| Quote: | Okay, you got me, indeed, the temperature on that graph is a local Greenland temperature. Let's look at global graphs then:
( data from http://dx.doi.org/10.1126/science.1228026 )
Are you happy with this correlation now? |
That's only one of the problems mentioned, but yeah, it's a little better
al-khemie is not a terrorist organization
"Chemicals, chemicals... I need chemicals!" - George Hayduke
"Wubbalubba dub-dub!" - Rick Sanchez
|
|
|
byko3y
National Hazard
Posts: 721
Registered: 16-3-2015
Member Is Offline
Mood: dooM
|
|
They still accept the
satellite data, that shows 0.3 C change in temperature anomaly globally, while the surface measurement tell us about 0.7 C raise of temperature
anomaly from 1980 to 2015. They mainly debunk the comparision of modeled and measured values.
Greenhouse theory suggests change of temperature in atmosphere should be larger then surface temperature, which is not the case, thus we have another
argument against theory of greenhouse as a main driver of climate.
What might be the actual cause? Some say it's solar activity ( https://wattsupwiththat.com/2012/09/13/paper-demonstrates-so... ), but the overall raise might be overestimated due to methodology of measurement
of surface temperature, and actual rise of temperature is indeed approximately 0.3 C (the temperature rose undoubtedly, that's not a question).
| Quote: |
That link does not support your description. It gives a pretty standard account of the time the UAH team insisted their data were right and everyone
else's were wrong, were shown to be incorrect, and had to account for orbital decay of their satellites with a correction so large that it changed the
sign of the long-term trend. This was not a case where "Mainstream politics had to reshuffle the satellite data"; it was one of the "random
statements" which ultimately "was rejected". I thought you were in favor of that? |
Maybe indeed the old data about coling is incorrect, and the new value of 0.3 C warming is correct - okay, not a big deal. we still got argument
against greenhouse theory.
| Quote: | | 12.5 is the ratio of water vapor concentration to CO2 concentration. Why are you dividing 12.5 by 4? What is the physical meaning of a quarter of the
ratio of concentrations? Why is dividing by 4 necessary to compare the relative concentrations to their relative radiative forcings? "Your number" was
a combination of the radiative forcings of CO2 and H2O, weighted by meaningless coefficients. Why are we comparing anything to it?
|
I divide the concentrations ratio onto heat absorption ratio, thus obtaining specific absorption ratio,
which is approximately 5:1. So if there was an equal concentration of water and carbon dioxide in atmosphere, then approximately 83% heat would be
absorbed by carbon dioxide and 17% absorbed by water, thus carbon dioxide becoming main greenhouse gas. But the current state of the earth show
opposite: water is the main greenhouse gas.
Precision of calculation plays no role here due to relatively large error of appropoximation, you might take 6:1, 4:1, 3:1, whatever.
| Quote: | | That this happened "long before there was any data to cherrypick" is one way we know that it *is not* a fact that "Official conclusion was made by
cherry picking from available data" |
Yes, the greenhouse theory was created long time ago, but it is not
proven yet - that's the fact even politics have to accept and include into their reports. The cherry picking comes when someone needs to state that
greenhouse climate theory was proven, then he needs to take partial data he likes and ignore everything else, thus he can claim "there's no data
showing CO2 is not the main driver of climate".
|
|
|
sodium_stearate
Hazard to Others
Posts: 255
Registered: 22-4-2011
Location: guard duty at the checkpoint
Member Is Offline
Mood: No mask.
|
|
We must also always keep in mind that there's
a huge economic dimension to "climate change" and
"global warming".
On one side there are oil and coal companies that
might like the data to be skewed in their favor, so that
they can continue their business as usual.
On the other side we have all of the "green" , "energy efficient"
things which are currently being thrown at us every day.
Those are seemingly endless, and the drive is a full-court
press to convince everyone to purchase expensive
"light bulbs", and to allow endless wind turbines to be
constructed. It is endless.
It is very tiring to watch this all unfolding, because
a good share of it seems to point back to basic human
nature in the form of greed on both sides.
Both sides tend to bend and twist science to force
it to help them "prove" that whatever they are selling
is something everyone needs.
And, just as any cheap salesman or carnival barker
knows, the more drama and urgency they can tack on to
their basic sales pitch, the more stirred up they can get
their suckers to be. They all know that stirred-up suckers
tend to make impulse purchases.
I find that a lot of this whole subject is attempting
to pull on the emotions of the general public, in order
to sell them one specific agenda, or another.
Sure there's good and proper science with plenty of
accurate data to analyze. But then we also have this
layer of salesmen trying to sell stuff under the guise
that science shows that we need their products now.
[Edited on 16-4-2018 by sodium_stearate]
"Opportunity is missed by most people
because it is dressed in overalls and it
looks like work" T.A. Edison
|
|
|
RawWork
Hazard to Others
Posts: 167
Registered: 10-2-2018
Member Is Offline
|
|
Yeah, that is similar to economic dimensions and tricks in other areas like health. They tell us to eat more, drink more, use pharmacy
products...while exactly opposite will give us health. As Dr Ross Horne found out, on day when doctors stopped working and came on riots, number of
patients decreased twice. Suddenly everybody became healthy. Also in my country one bus was in flames after being parked overnight on some location,
and company said: "competition".
Haha, now I use word competition in so many funny ways. Whenever some s#*t happens either in real life or in movie, and somebody asks "what?", "why?",
"who?", I say COMPETITION.
Competition everywhere. In Syria, In Korea, in food, in health, in vehicles, in sports, in games... Whenever blood gets spilled, or explosion happens,
or crime...it's always they...THE COMPETITION. 
|
|
|
mayko
International Hazard
Posts: 1218
Registered: 17-1-2013
Location: Carrboro, NC
Member Is Offline
Mood: anomalous (Euclid class)
|
|
| Quote: Originally posted by byko3y | They still accept the
satellite data, that shows 0.3 C change in temperature anomaly globally, while the surface measurement tell us about 0.7 C raise of temperature
anomaly from 1980 to 2015. They mainly debunk the comparision of modeled and measured values.
Greenhouse theory suggests change of temperature in atmosphere should be larger then surface temperature, which is not the case, thus we have another
argument against theory of greenhouse as a main driver of climate. |
Whoa, hold on. You're changing the subject from modeled vs measured tropospheric trends, to tropospheric vs. surface trends, and making a new claim
about attribution. Neither the RealClimate, nor WUWT (lol) nor "American Experiment" (LOL) posts mentioned this at all. Can you give a reputable
source for where you're getting this information? Because I suspect it'll be just as questionable.
| Quote: |
| Quote: | | 12.5 is the ratio of water vapor concentration to CO2 concentration. Why are you dividing 12.5 by 4? What is the physical meaning of a quarter of the
ratio of concentrations? Why is dividing by 4 necessary to compare the relative concentrations to their relative radiative forcings? "Your number" was
a combination of the radiative forcings of CO2 and H2O, weighted by meaningless coefficients. Why are we comparing anything to it?
|
I divide the concentrations ratio onto heat absorption ratio, thus obtaining specific absorption ratio, which is approximately 5:1. So if there was an
equal concentration of water and carbon dioxide in atmosphere, then approximately 83% heat would be absorbed by carbon dioxide and 17% absorbed by
water, thus carbon dioxide becoming main greenhouse gas. But the current state of the earth show opposite: water is the main greenhouse gas.
Precision of calculation plays no role here due to relatively large error of appropoximation, you might take 6:1, 4:1, 3:1, whatever.
|
IR opacity (and hence radiative forcing) is not a linear function of concentration (it's exponential, comparable to Beer's law). As such, the ratio of
absorption by CO2 and H2O at equal concentration, isn't a constant - it's a function of concentration. Calculating a "specific absorption ratio" by
scaling their radiative forcings by their relative concentrations is not meaningful.
If I wanted to go through the trouble of computing the radiative forcings of individual greenhouse gasses at equal concentration, I'd probably use a
radiative transfer equation solver, such as this one:
http://climatemodels.uchicago.edu/modtran/
Doing so is overkill in this case. If you'll recall, these calculations were in support of the statement, "Concentration isn't the same as impact". To
see this is a FACT, one need only consider that, in spite of being 12.5 times as concentrated as CO2, water vapor does not exert 12.5 times as strong
a greenhouse effect as CO2, but instead, less than three times as strong. (I'm not sure I'd call 8% "insignificant", either, but whatever.)
Even if it was meaningful to calculate a "specific absorption ratio", I have no idea why you'd compare it to the gas mixing ratio, and even less why
you'd expect them to be equal.
As I've mentioned, even the 3x figure is misleading outside the context of well-established FACTS of physical chemistry.
| Quote: | | Yes, the greenhouse theory was created long time ago, but it is not proven yet - that's the fact even politics have to accept and include into their
reports. The cherry picking comes when someone needs to state that greenhouse climate theory was proven, then he needs to take partial data he likes
and ignore everything else, thus he can claim "there's no data showing CO2 is not the main driver of climate". |
Nothing in science is "proven". Evolution, gravity, relativity, Ohm's law, atomic theory, and the periodic table are "not proven". If you you want
"proof", that's down the hall in the math department. If you're asking about decisive evidence in favor of anthropogenic, GHG-driven global warming,
then yes, there's a decent pile of that.
al-khemie is not a terrorist organization
"Chemicals, chemicals... I need chemicals!" - George Hayduke
"Wubbalubba dub-dub!" - Rick Sanchez
|
|
|
byko3y
National Hazard
Posts: 721
Registered: 16-3-2015
Member Is Offline
Mood: dooM
|
|
| Quote: | | Whoa, hold on. You're changing the subject from modeled vs measured tropospheric trends, to tropospheric vs. surface trends, and making a new claim
about attribution. Neither the RealClimate, nor WUWT (lol) nor "American Experiment" (LOL) posts mentioned this at all. Can you give a reputable
source for where you're getting this information? Because I suspect it'll be just as questionable. |
The original publication from John Christy is here: http://docs.house.gov/meetings/SY/SY00/20160202/104399/HHRG-...
You might want to plot the graphs yourself from the satellite and ballons data (the data on the graph is: "average of 102 IPCC CMIP5 climate models
(red), the average of 3 satellite datasets (green -UAH, RSS, NOAA) and 4 balloon datasets (blue, NOAA, UKMet, RICH, RAOBCORE). " )
| Quote: | | Nothing in science is "proven". Evolution, gravity, relativity, Ohm's law, atomic theory, and the periodic table are "not proven". If you you want
"proof", that's down the hall in the math department. If you're asking about decisive evidence in favor of anthropogenic, GHG-driven global warming,
then yes, there's a decent pile of that. |
"Proven" practicaly means being not refuted experimentally.
Multiple experimental data show green house theory is invalid and must be either adjusted for the new facts or rejected as a whole. I talk about
history of high CO2 concentration that did not lead to warming and "surface-first" nature of the current warming.
Update: last known to me corrections by Christy http://science.sciencemag.org/content/310/5750/972.long give the value of +0.123 K/decade warming (0.035 K/decade correction) as of 2005 year, the
time when anomaly stopped its raise.
[Edited on 16-4-2018 by byko3y]
|
|
|
mayko
International Hazard
Posts: 1218
Registered: 17-1-2013
Location: Carrboro, NC
Member Is Offline
Mood: anomalous (Euclid class)
|
|
| Quote: Originally posted by byko3y | | Quote: | | Whoa, hold on. You're changing the subject from modeled vs measured tropospheric trends, to tropospheric vs. surface trends, and making a new claim
about attribution. Neither the RealClimate, nor WUWT (lol) nor "American Experiment" (LOL) posts mentioned this at all. Can you give a reputable
source for where you're getting this information? Because I suspect it'll be just as questionable. |
The original publication from John Christy is here: http://docs.house.gov/meetings/SY/SY00/20160202/104399/HHRG-...
You might want to plot the graphs yourself from the satellite and ballons data (the data on the graph is: "average of 102 IPCC CMIP5 climate models
(red), the average of 3 satellite datasets (green -UAH, RSS, NOAA) and 4 balloon datasets (blue, NOAA, UKMet, RICH, RAOBCORE). " )
|
Now you're changing the subject back to satellites vs surface records. I asked you about your claim of modeled vs measured trends and attribution. We
can talk about either (more on satellites here, for example, this time from Rasmus Benestad: "it is an indisputable fact that Christy’s graph presents numbers with different meanings as if they were equivalent" ) but you need to pick one.
Or, if you want, we could talk about about something else entirely. For example, we could talk about the generally good agreement between modeled and
measured surface temperatures
| Quote: | | Proven" practicaly means being not refuted experimentally. |
This isn't a good working definition of proof, and it's not a good standard of evidence in general, for a number of reasons. Here's an example: You
owe me $100. I can prove it: nobody's 'refuted experimentally' my claim, now have they? So pay up! xD
| Quote: | | Multiple experimental data show green house theory is invalid and must be either adjusted for the new facts or rejected as a whole. I talk about
history of high CO2 concentration that did not lead to warming and "surface-first" nature of the current warming. |
It is a FACT that every theory must be adjusted to new facts; it is NOT a FACT that observations are so critically inconsistent with theoretical
expectations that the underlying theory must be thrown out.
To the extent I understand what "experimental data" you're talking about here, it's already been addressed.
I don't think that exchange supports your case generally, especially not such zingers as:
| Quote: |
...it is hard to believe that Christy and Spencer would argue that a data set showing the “wrong” amount of warming must therefore be flawed. If
that were a valid argument, their own satellite analysis would have been discarded years ago. |
Attachment: Correcting Temperature Data Sets.pdf (269kB)
This file has been downloaded 323 times
It is not the case that measure temperatures stopped rising in 2005; this is not true of satellite measurements generally (not even UAH!), nor
radiosondes, nor surface stations. For example, here's a side-by-side comparison of different satellite and balloon records, with important discussion
and context:
https://tamino.wordpress.com/2016/11/27/which-satellite-data...
al-khemie is not a terrorist organization
"Chemicals, chemicals... I need chemicals!" - George Hayduke
"Wubbalubba dub-dub!" - Rick Sanchez
|
|
|
byko3y
National Hazard
Posts: 721
Registered: 16-3-2015
Member Is Offline
Mood: dooM
|
|
| Quote: | | Now you're changing the subject back to satellites vs surface records. I asked you about your claim of modeled vs measured trends and attribution
|
I don't really understand why anyone would care about model that is being changed regulary, while we have
some actual data that is still not fully understood. Most of the critic comes about model and its comparision, while the actual measured data is much
more enlightening.
| Quote: | | This isn't a good working definition of proof, and it's not a good standard of evidence in general, for a number of reasons. Here's an example: You
owe me $100. I can prove it: nobody's 'refuted experimentally' my claim, now have they? So pay up! xD |
That's
the scenario I've already described and it is used widely to "prove" something. I don't know what word would fit the definition better though, but
that's the way science method works: nothing is truth, everything is just a theory that was already refuted or was not refuted yet.
| Quote: | It is a FACT that every theory must be adjusted to new facts; it is NOT a FACT that observations are so critically inconsistent with theoretical
expectations that the underlying theory must be thrown out.
To the extent I understand what "experimental data" you're talking about here, it's already been addressed. |
I don't see much difference between throwing out the theory and adjusting it. I want to emphasize: I'm not talking about grenhouse effect in general,
because it definitely exists, I'm talking about unknow relation of greenhouse effect to the climate on Earth.
| Quote: | I don't think that exchange supports your case generally, especially not such zingers as:
| Quote: | | ...it is hard to believe that Christy and Spencer would argue that a data set showing the “wrong” amount of warming must therefore be flawed. If
that were a valid argument, their own satellite analysis would have been discarded years ago. |
|
I dont understand your argument. Validity of satellite data is currently accepted after corrections. Probably they are put under pressure because they
involuntarily oppose the current party policy. They try to readjust their measurements by every possible mean, but they find few opportunities,
because the data is a fact, you can't change it and many eyes are watching your moves while you are interptering the data.
| Quote: | | It is not the case that measure temperatures stopped rising in 2005; this is not true of satellite measurements generally (not even UAH!), nor
radiosondes, nor surface stations. For example, here's a side-by-side comparison of different satellite and balloon records, with important discussion
and context: |
Okay, you are corect, I didn't pay atention to that because in any case the gradient of
temperature of anomaly is approximately half of that measured at surface, which by itself refutes the currently accepted grerenhouse theory of
climate.
|
|
|
mayko
International Hazard
Posts: 1218
Registered: 17-1-2013
Location: Carrboro, NC
Member Is Offline
Mood: anomalous (Euclid class)
|
|
| Quote: | | I don't really understand why anyone would care about model that is being changed regulary, while we have some actual data that is still not fully
understood. Most of the critic comes about model and its comparision, while the actual measured data is much more enlightening.
|
If you don't care about models, I don't know why you brought them up. They are used because they are an important and powerful tool for understanding
data. Your characterizations of the controversies is not accurate: there are plenty of critics of the data and their interpretations, many of them
just as questionable as the criticisms you've given of models.
| Quote: | | Quote: | | This isn't a good working definition of proof, and it's not a good standard of evidence in general, for a number of reasons. Here's an example: You
owe me $100. I can prove it: nobody's 'refuted experimentally' my claim, now have they? So pay up! xD |
That's
the scenario I've already described and it is used widely to "prove" something. I don't know what word would fit the definition better though, but
that's the way science method works: nothing is truth, everything is just a theory that was already refuted or was not refuted yet.
|
But that's not the same at all! First you told me that something was "proven", if it had not yet been 'experimentally refuted'; then you turn around
and tell me that it's actually "just a theory". Which one is it? Moreover, if you actually believe that "everything is just a theory" and "nothing is
truth"............ why on earth would you insist on "proof" in the first place? Especially when you probably find Mere Theories to be actionable
elsewhere (do you need 'proof' of gravity to know not to jump off a cliff?) And how 'bout that hundo?????????
It sounds like you're describing falsification, which is an important process in science, but hardly the totality of how science works (though you're
right that it's often taught as though it is). For one thing, naive falsification provides no way forward when different experiments, different data,
and different analyses are at odds, as they often are. For another, it is incapable of making positive claims: falsification can never say that
something is a true, but can only say that it's not been shown to be false. Is this really how a fact-lover such as yourself sees science, as a
collection of non-facts waiting to decay into anti-facts? Do you really believe that it's not "truth" that atoms exist or that phosgene is incredibly
toxic, only that these things have not yet been ruled out?
| Quote: |
I don't see much difference between throwing out the theory and adjusting it. I want to emphasize: I'm not talking about grenhouse effect in general,
because it definitely exists, I'm talking about unknow relation of greenhouse effect to the climate on Earth. |
I'm sorry to hear your philosophy of science is so brittle! I myself don't see much difference between the greenhouse effect in general and the known
relation of the greenhouse effect to the climate on earth.
| Quote: |
I dont understand your argument. Validity of satellite data is currently accepted after corrections. |
I've posted several links to articles by practicing climatologists about this from various angles: satellite-based temperature data are not direct
measurements of tropospheric temperature; they are a physically informed but computationally-based inference from microwave brightness as measured
through the stratosphere with its own signal, and they are susceptible to a variety of biases and artifacts. They are valuable information, but not
inherently more reliable than the surface record (the RSS researchers acknowledge as much). The UAH data in particular are not well regarded for a
number of reasons, including its lack of agreement with similar datasets, the lack of transparency in its methods (just try and find their algorithm
for converting microwave brightness to temperature!), and Spencer & Christy's long, well-documented history of being completely full of it (one of
your own sources has whole categories for their goofs called "Christy Crocks" and "Spencer Slip-Ups" ).
| Quote: | | Probably they are put under pressure because they involuntarily oppose the current party policy. They try to readjust their measurements by every
possible mean, but they find few opportunities, because the data is a fact, you can't change it and many eyes are watching your moves while you are
interptering the data. |
It's a good thing I know you like facts so much, or I'd have mistaken this for baseless, ideologically motivated speculation
| Quote: | in any case the gradient of temperature of anomaly is approximately half of that measured at surface, which by itself refutes the currently accepted
grerenhouse theory of climate.[/rquote]
Okay, you're changing the subject again away from models and back to tropospheric vs surface measurements and attribution. Are you going to back this
up, especially the attribution part? How do you reconcile this claim with positive evidence in favor of greenhouse warming, such as nights warming
faster than days, or winters warming faster than summers? |
al-khemie is not a terrorist organization
"Chemicals, chemicals... I need chemicals!" - George Hayduke
"Wubbalubba dub-dub!" - Rick Sanchez
|
|
|
byko3y
National Hazard
Posts: 721
Registered: 16-3-2015
Member Is Offline
Mood: dooM
|
|
You are making mountain out of molehill. I explaned in the very next message that "proven" means "not refuted". I tried to fall and it hurts - that's
sufficient proof of gravitation to me. I'm talking about Popper's definition of scientific method.
And that's the reason it is so vulnerable to cherry picking.
And I know well about phylosophical, religious, and political constituents of the modern science, but I prefere to ignore them, because they have
nothing to deal with scientific method. Of course I can say something is true, I can believe in god, but that's not something we like to talk about
here at sciencemadness.
| Quote: | | I myself don't see much difference between the greenhouse effect in general and the known relation of the greenhouse effect to the climate on earth.
|
If you look at the graph of the modern temperature global anomaly, you will find that small period
fluctuations can be much more prominent than long time ones. It's even more prominent when looking at local temperatures. Thus Earth has some strong
climate-driving mechanisms, and whether or not they can overcome or compensate for greenhouse effect - is one open question.
Another open question might be illustrated with picture:
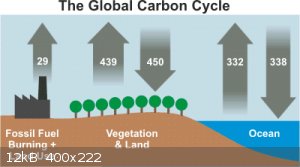
The largest producers of carbon dioxide on Earth is not human's industry, but ocean and plants. So if impact of fossil fuel burn is insignificant,
could it be another mechanism responsible for both raise in CO2 level and temperature anomaly?
| Quote: | | They are valuable information, but not inherently more reliable than the surface record (the RSS researchers acknowledge as much). The UAH data in
particular are not well regarded for a number of reasons, including its lack of agreement with similar datasets, the lack of transparency in its
methods (just try and find their algorithm for converting microwave brightness to temperature!), and Spencer & Christy's long, well-documented
history of being completely full of it (one of your own sources has whole categories for their goofs called "Christy Crocks" and "Spencer Slip-Ups" ).
|
You just needed to provide data from another satellites and methods of their processing showing us that
satellites are not reliable. I just don't feel like that's the case, I feel more like the propaganda machine targeted those researchers to defame the
facts they published.
| Quote: | | Okay, you're changing the subject again away from models and back to tropospheric vs surface measurements and attribution. Are you going to back this
up, especially the attribution part? How do you reconcile this claim with positive evidence in favor of greenhouse warming, such as nights warming
faster than days, or winters warming faster than summers? |
When you have one experimental data in favor and
one expelrimental data against the theory, then you might say that the theory is doubtful or incomplete. That's the case of the currently accepted
greenhouse theory of climate: some facts confirm it, some facts not confirm it.
|
|
|
MrHomeScientist
International Hazard
Posts: 1806
Registered: 24-10-2010
Location: Flerovium
Member Is Offline
Mood: No Mood
|
|
I'm reluctant to butt in, but if I understand that picture correctly the up arrows are carbon releases into the atmosphere and down arrows are carbon
sinks. The ocean and plants are nearly neutral, but there is no corresponding down arrow for fossil fuel burning. If you add up the numbers, that's
still net 12 Somethings (whatever that number signifies) going into the atmosphere, all from fossil fuels. So clearly we're adding more CO2
than can be sequestered, right? And CO2 contributes to the greenhouse effect and general warming, right?
|
|
|
DrP
National Hazard
Posts: 625
Registered: 28-9-2005
Member Is Offline
Mood: exothermic
|
|
| Quote: Originally posted by MrHomeScientist | | I'm reluctant to butt in, but if I understand that picture correctly the up arrows are carbon releases into the atmosphere and down arrows are carbon
sinks. The ocean and plants are nearly neutral, but there is no corresponding down arrow for fossil fuel burning. If you add up the numbers, that's
still net 12 Somethings (whatever that number signifies) going into the atmosphere, all from fossil fuels. So clearly we're adding more CO2
than can be sequestered, right? And CO2 contributes to the greenhouse effect and general warming, right? |
Correct as far as I know/can see.... but I am no climate expert.
I think mayko is doing a good job... I can't never keep up with these conversations - you rebuff one comment only to have the point changed and the
goal posts moved or the direction pointed to some other spurious misinformation that is only part relevant.... and your original rebuttal of a single
point gets forgotten until the cycle of the argument come around again to the original point that they still stand by even though you have given data
and studies that rebut it - it's like talking religion.
[Edited on 17-4-2018 by DrP]
\"It\'s a man\'s obligation to stick his boneration in a women\'s separation; this sort of penetration will increase the population of the younger
generation\" - Eric Cartman
|
|
|
byko3y
National Hazard
Posts: 721
Registered: 16-3-2015
Member Is Offline
Mood: dooM
|
|
MrHomeScientistOcean contains approx 40 000 gigatonns of CO2 dissolved. Atmosphere contains 3000 gigatonns of CO2. On the picture
i've posted plants and ocean absorb 17 Gt of CO2, while humanity produces 29. In fact humanity produced 10 Gt in 2015 year ( https://www.co2.earth/global-co2-emissions ), but the CO2 level is still rising, which is consistent with theory that influence of humanity on CO2
level in atmosphere is insignificant.
DrP, nobody is forcing you to read the thread.
|
|
|
| Pages:
1
2
3
4 |
|